
US IPO bookrunners
2026 to date · US-listed IPOs to 20 Nov 2026 · 64 deals · US$100bn disclosed
Deals completed after 30 September 2026 are still being collected.
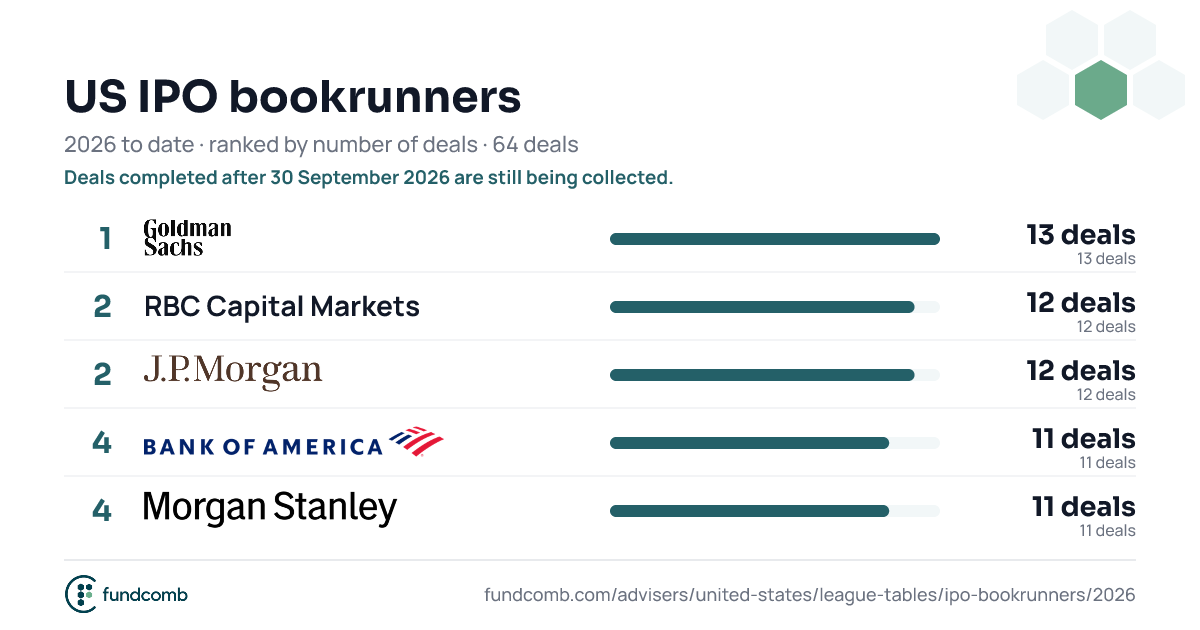
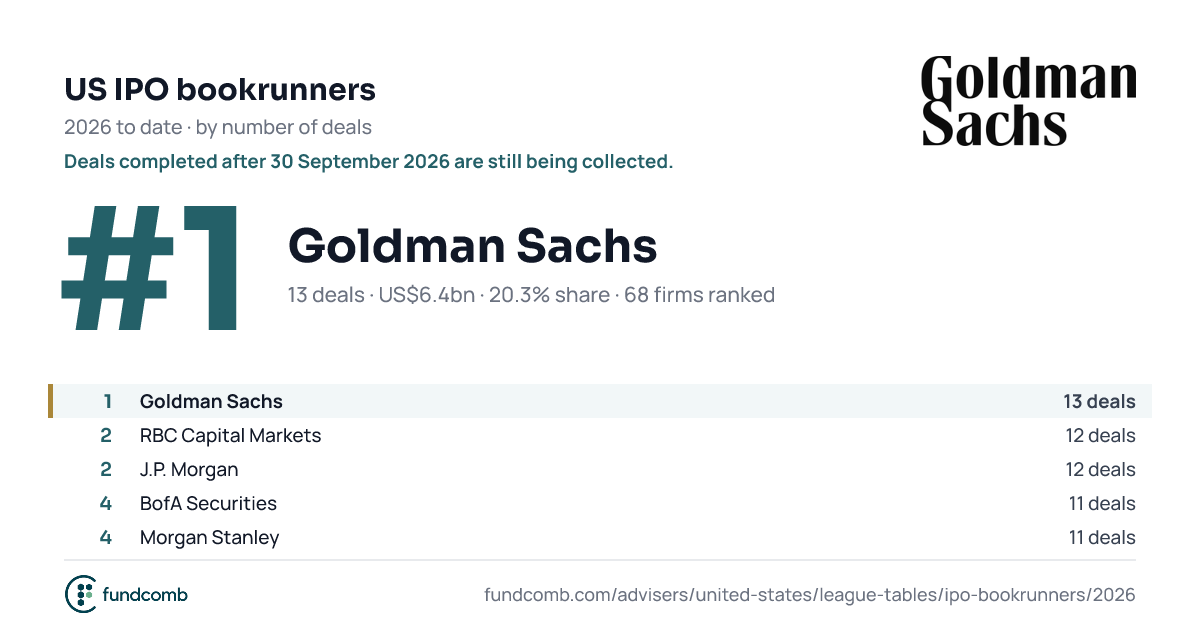
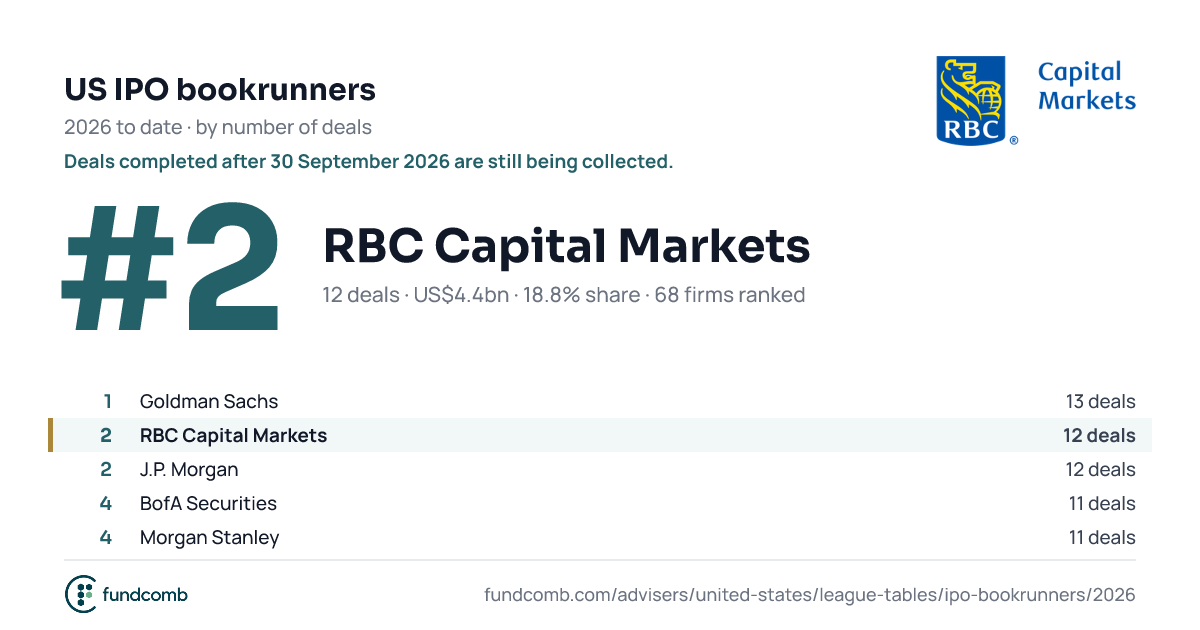
| 1 | Goldman Sachs US$6.4bn · 20.3% share · new | 6,379.0 | 20.3% | New | |
| |||||
| 2 | RBC Capital Markets US$4.4bn · 18.8% share · new | 4,351.8 | 18.8% | New | |
| |||||
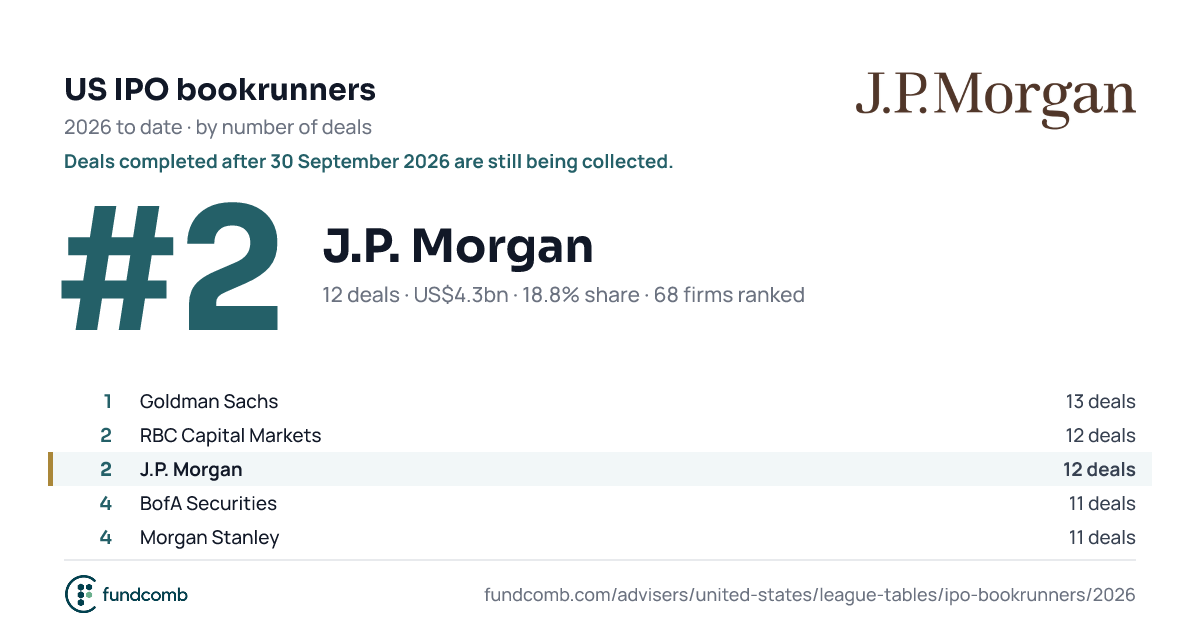
| 2 | J.P. Morgan US$4.3bn · 18.8% share · new | 4,272.6 | 18.8% | New | |
| |||||
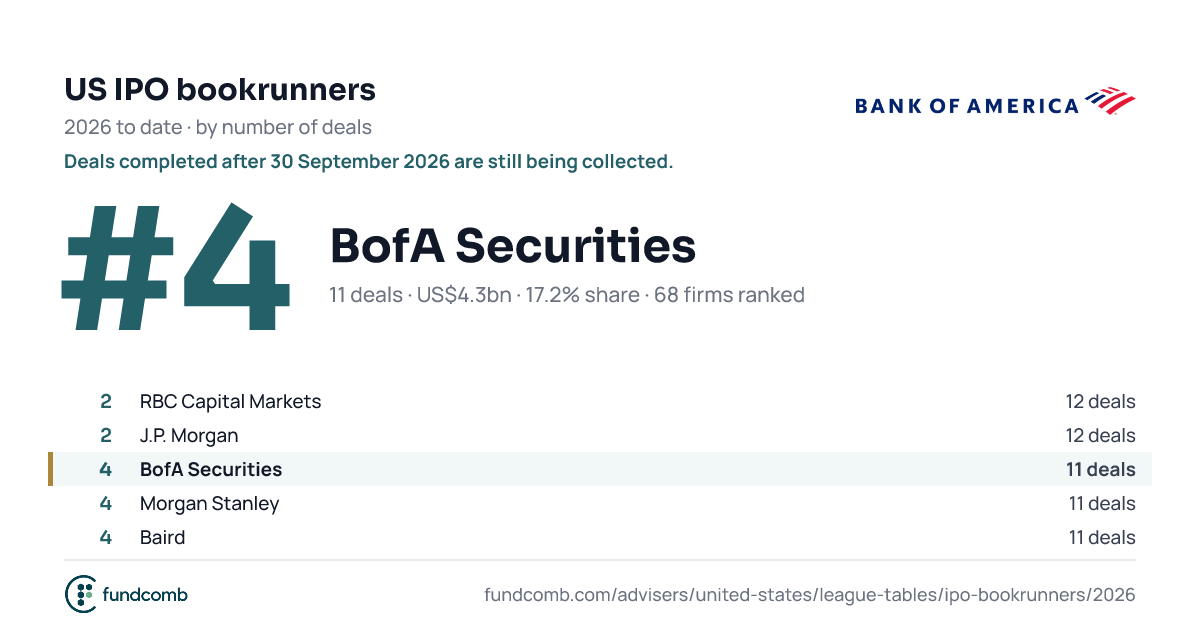
| 4 | BofA Securities US$4.3bn · 17.2% share · new | 4,253.0 | 17.2% | New | |
| |||||
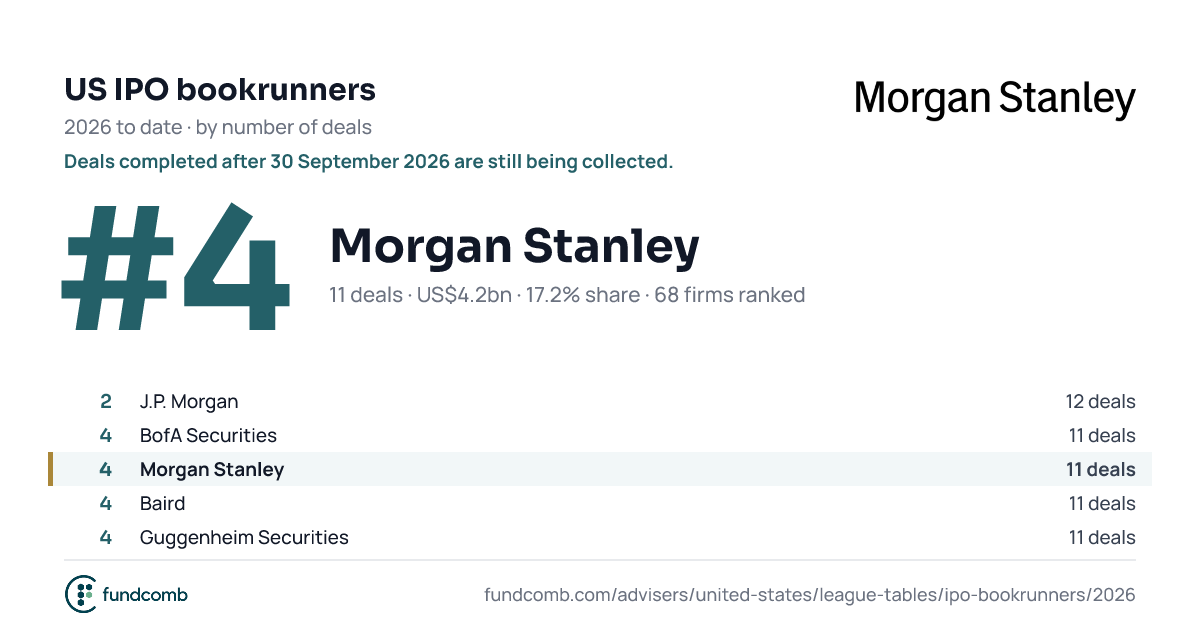
| 4 | Morgan Stanley US$4.2bn · 17.2% share · new | 4,157.1 | 17.2% | New | |
| |||||
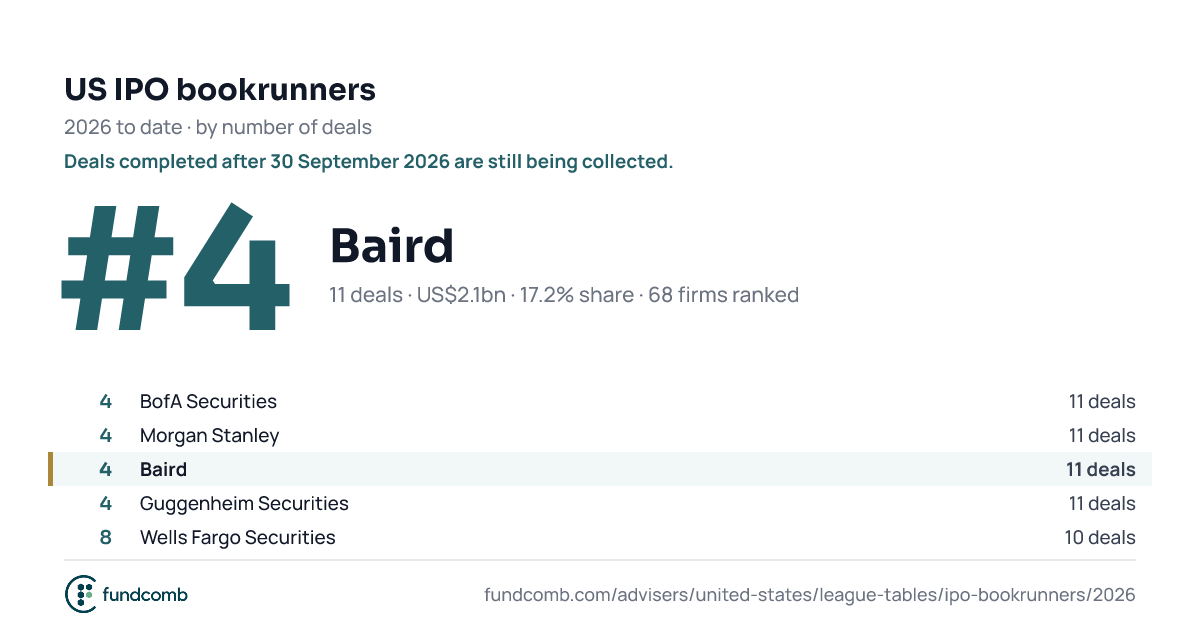
| 4 | Baird US$2.1bn · 17.2% share · new | 2,074.1 | 17.2% | New | |
| |||||
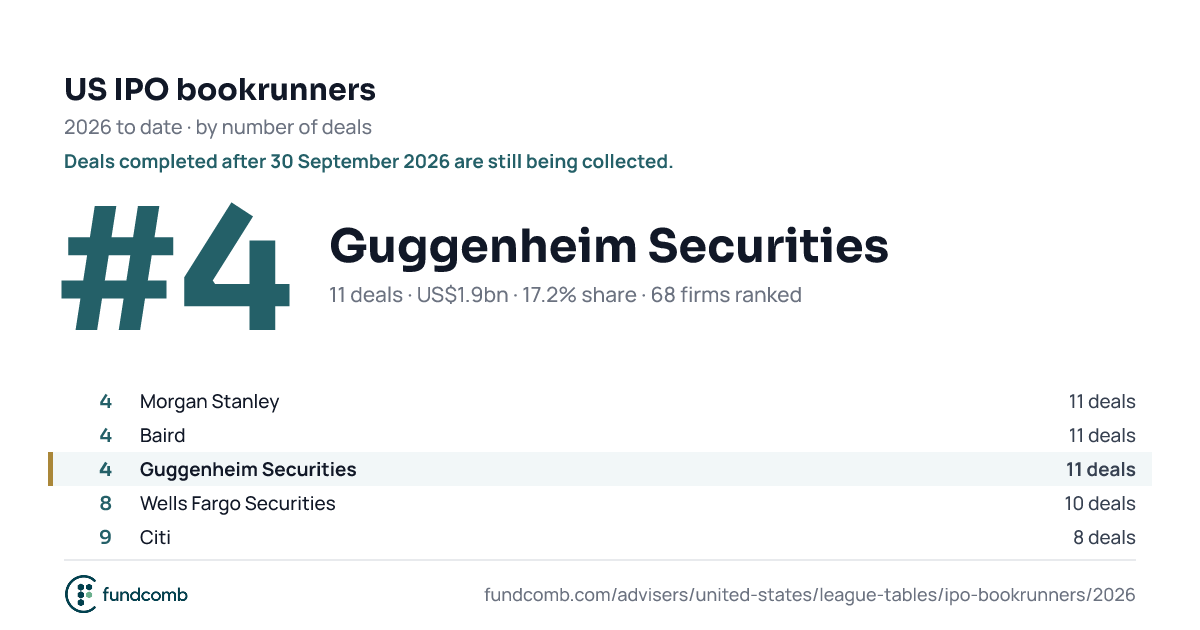
| 4 | Guggenheim Securities US$1.9bn · 17.2% share · new | 1,940.4 | 17.2% | New | |
| |||||
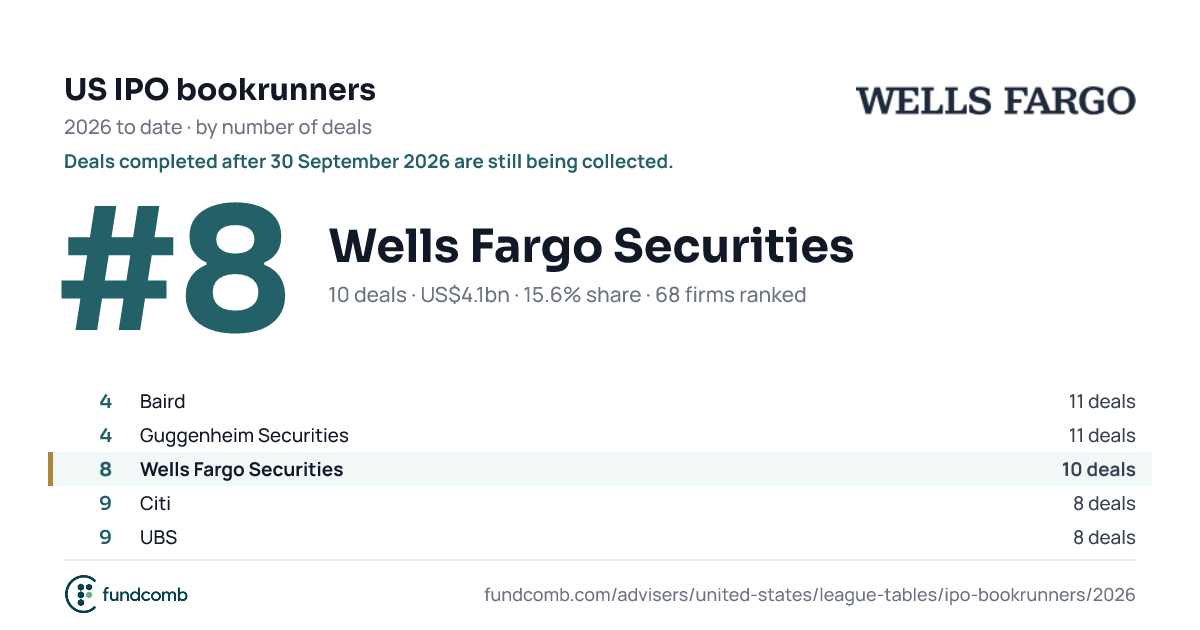
| 8 | Wells Fargo Securities US$4.1bn · 15.6% share · new | 4,067.1 | 15.6% | New | |
| |||||
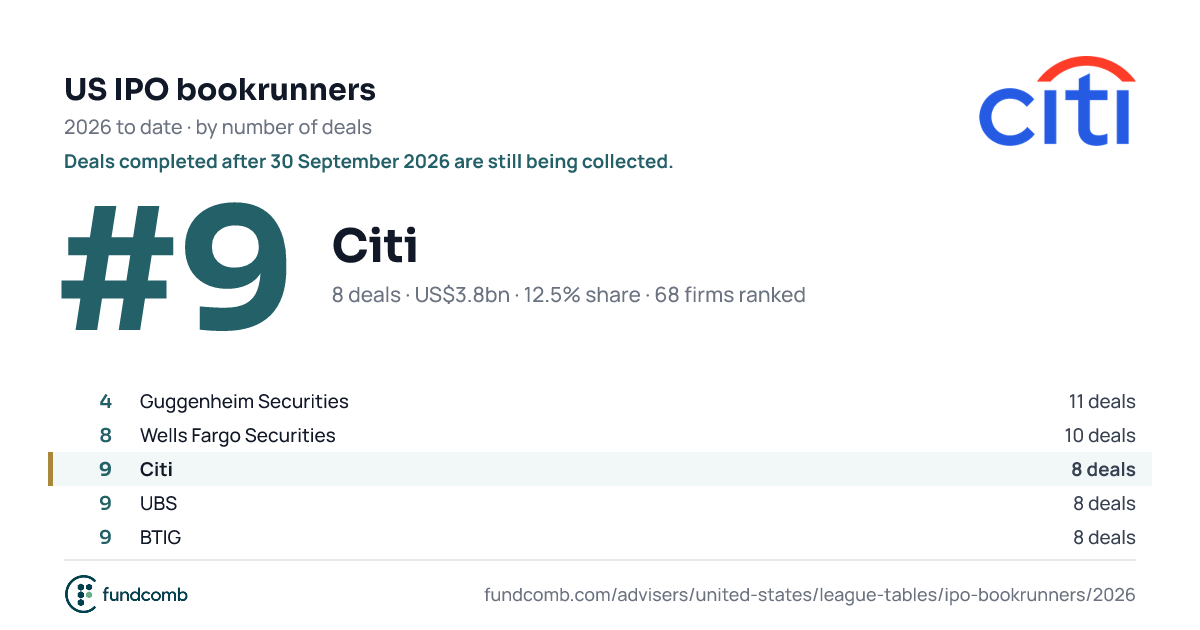
| 9 | Citi US$3.8bn · 12.5% share · new | 3,836.8 | 12.5% | New | |
| |||||
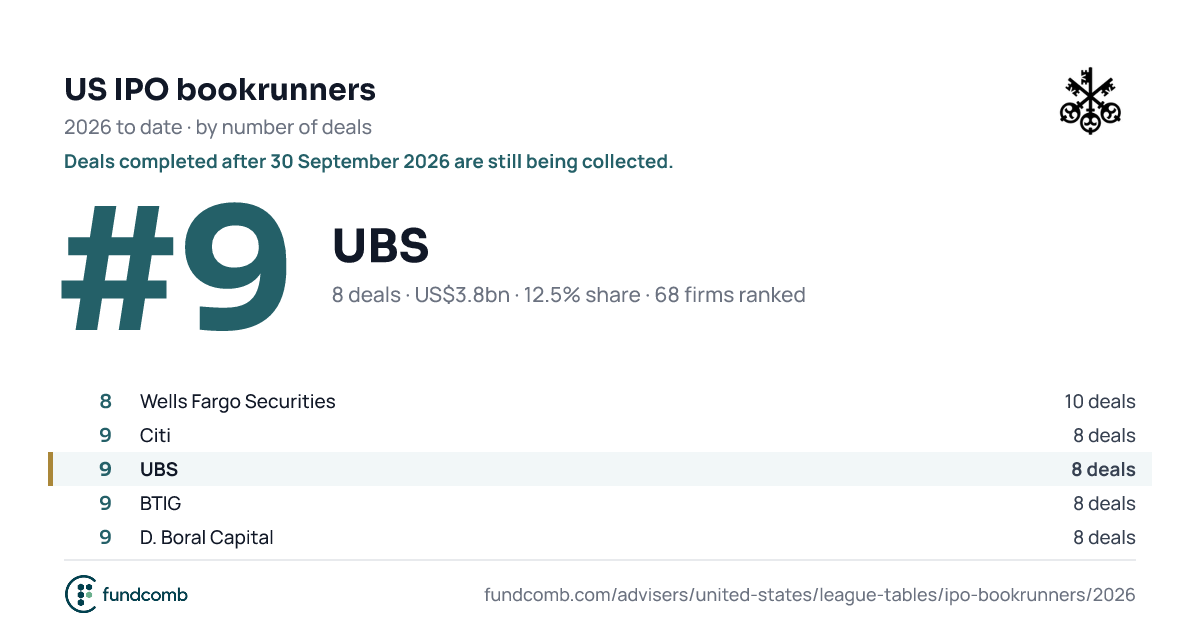
| 9 | UBS US$3.8bn · 12.5% share · new | 3,766.1 | 12.5% | New | |
| |||||
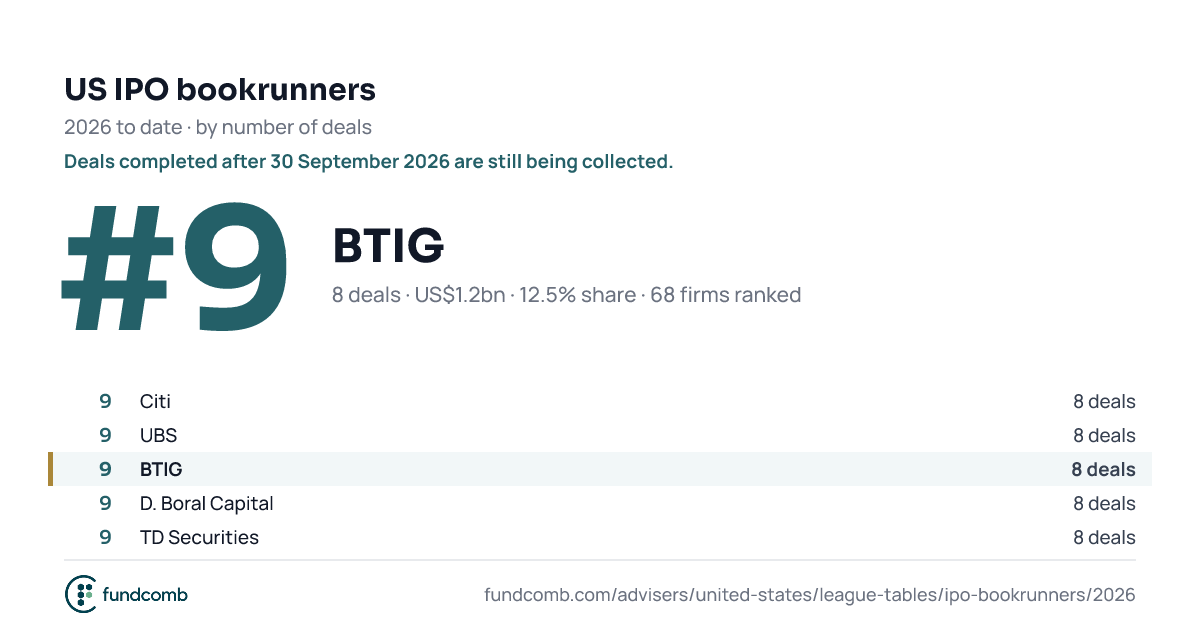
| 9 | BTIG US$1.2bn · 12.5% share · new | 1,205.9 | 12.5% | New | |
| |||||
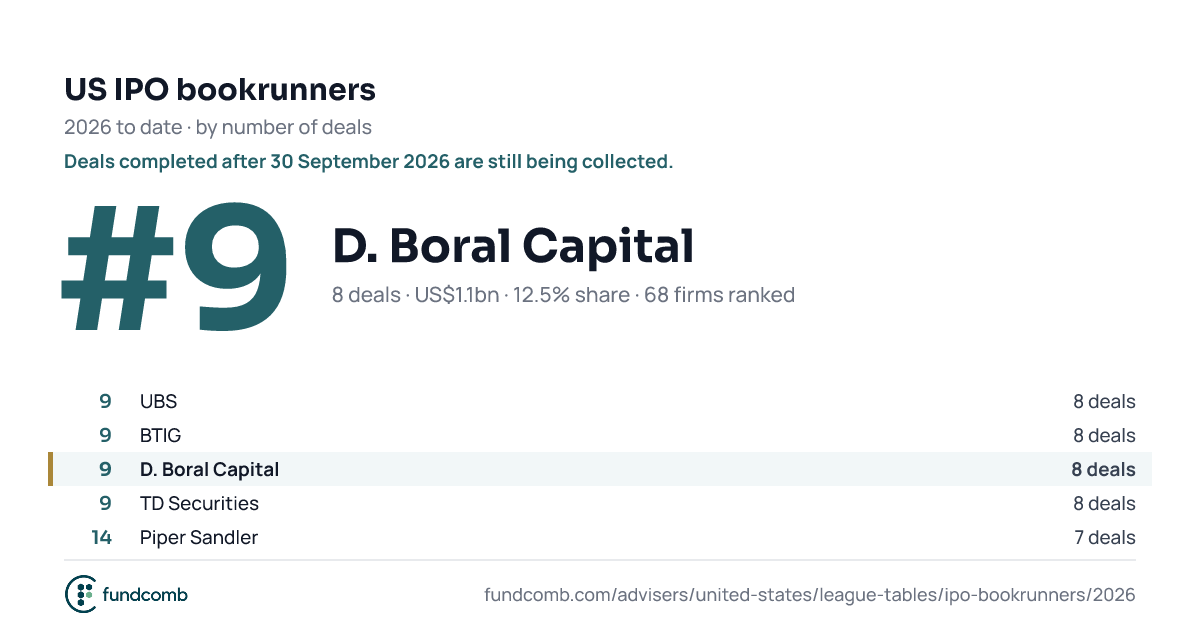
| 9 | D. Boral Capital US$1.1bn · 12.5% share · new | 1,063.5 | 12.5% | New | |
| |||||
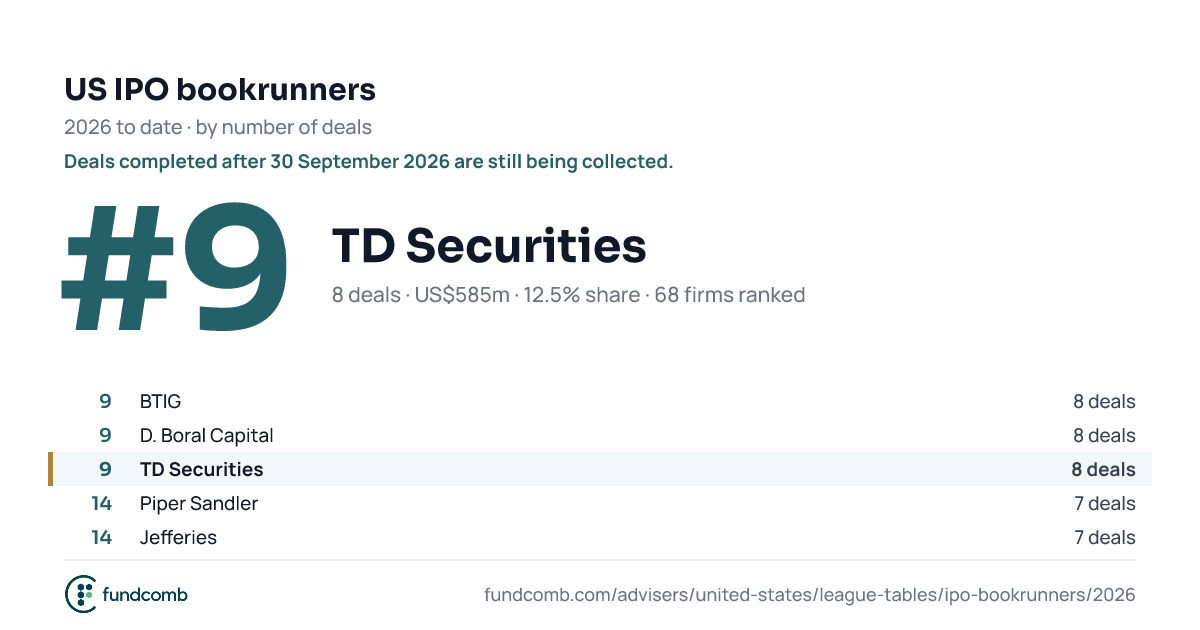
| 9 | TD Securities US$585m · 12.5% share · new | 584.7 | 12.5% | New | |
| |||||
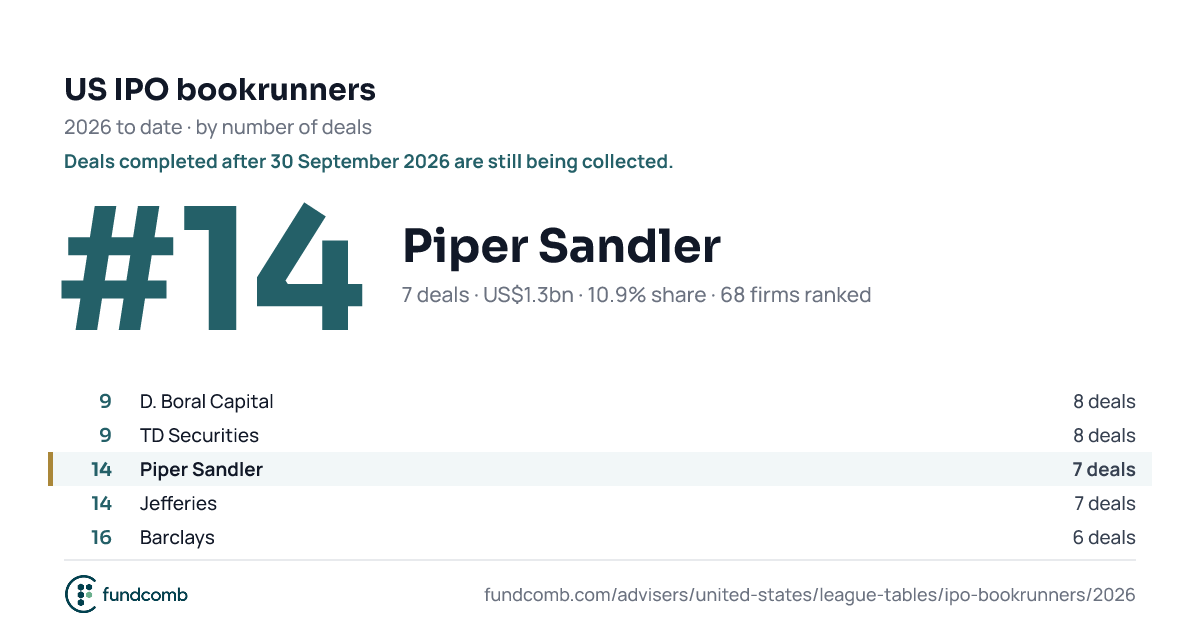
| 14 | Piper Sandler US$1.3bn · 10.9% share · new | 1,316.5 | 10.9% | New | |
| |||||
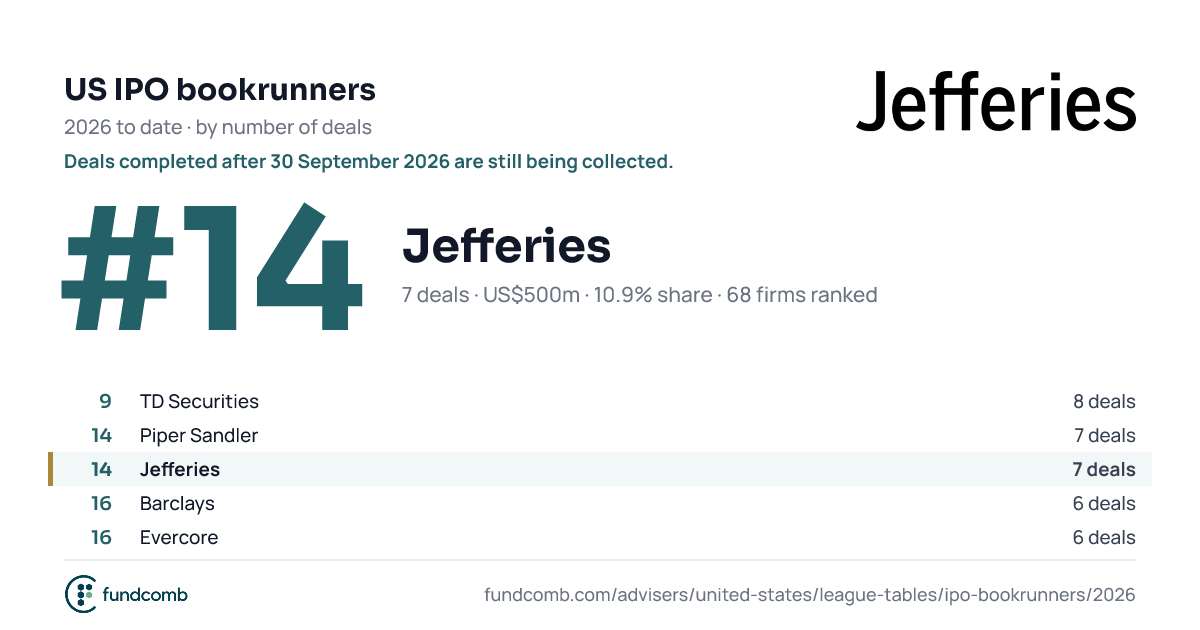
| 14 | Jefferies US$500m · 10.9% share · new | 500.2 | 10.9% | New | |
| |||||
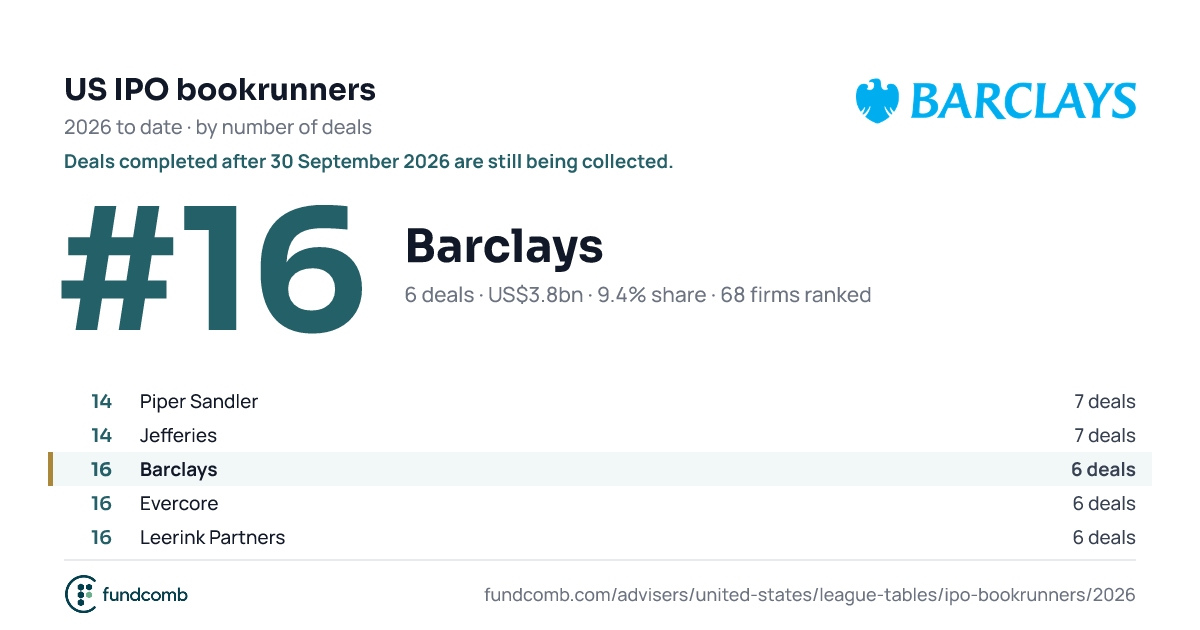
| 16 | Barclays US$3.8bn · 9.4% share · new | 3,840.7 | 9.4% | New | |
| |||||
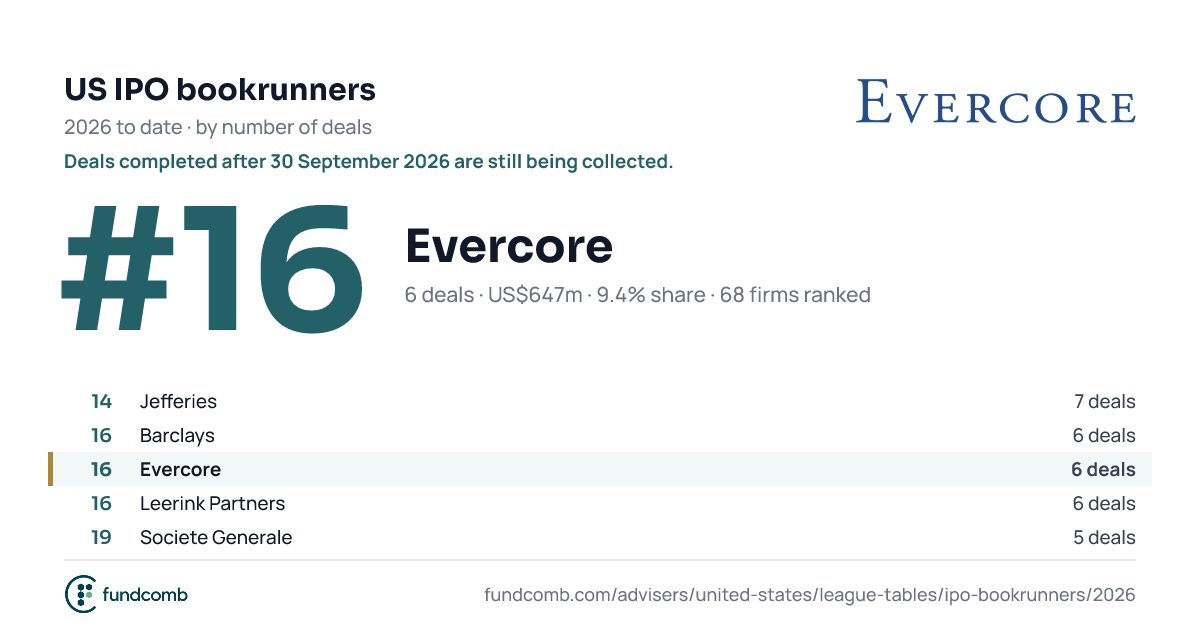
| 16 | Evercore US$647m · 9.4% share · new | 647.2 | 9.4% | New | |
| |||||
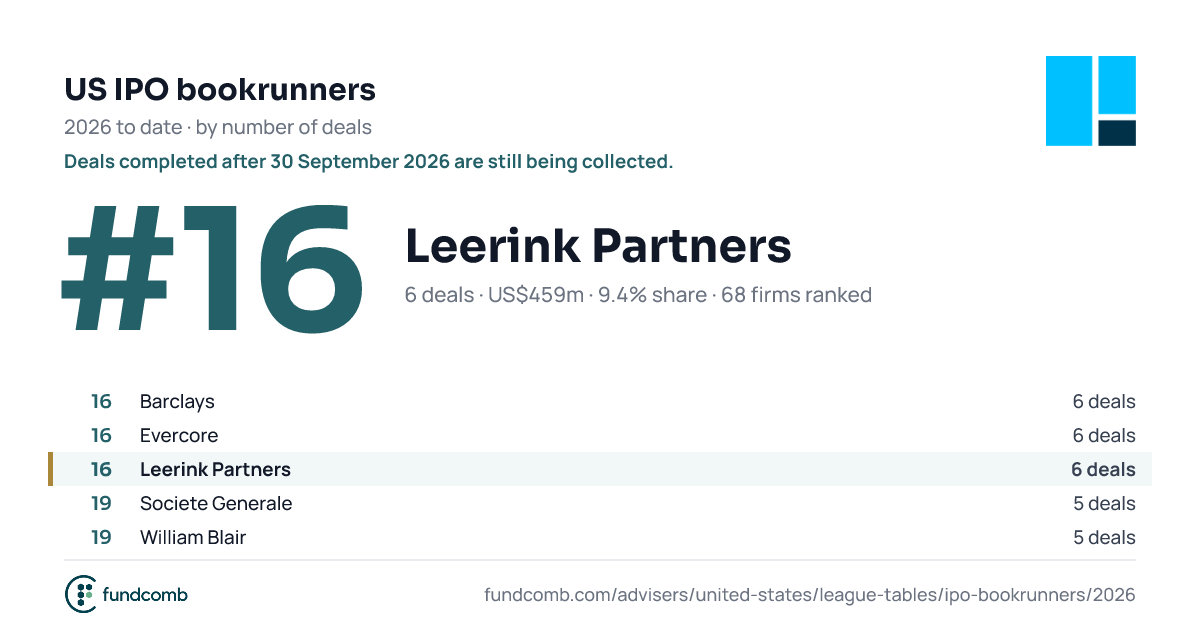
| 16 | Leerink Partners US$459m · 9.4% share · new | 459.5 | 9.4% | New | |
| |||||
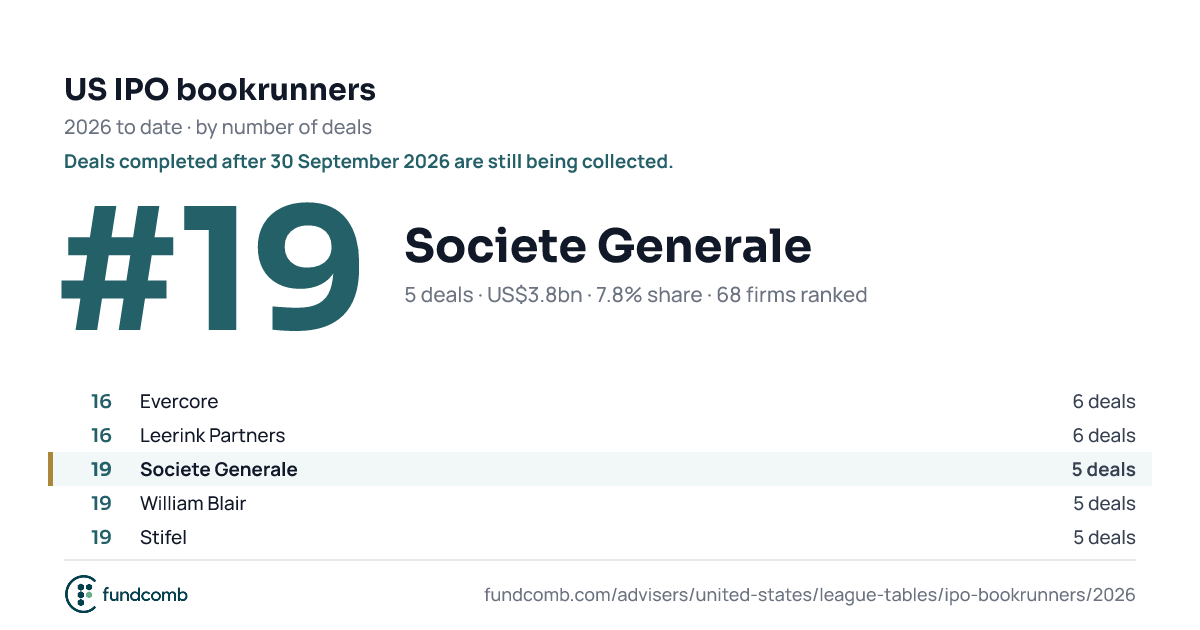
| 19 | Societe Generale US$3.8bn · 7.8% share · new | 3,798.4 | 7.8% | New | |
| |||||
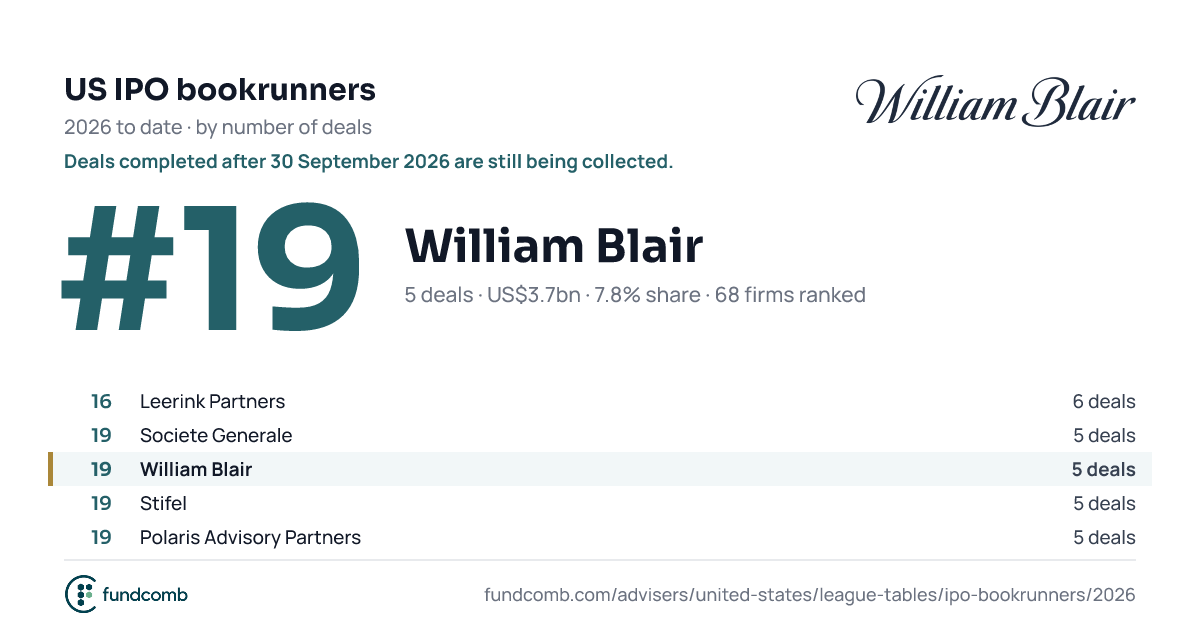
| 19 | William Blair US$3.7bn · 7.8% share · new | 3,726.5 | 7.8% | New | |
| |||||
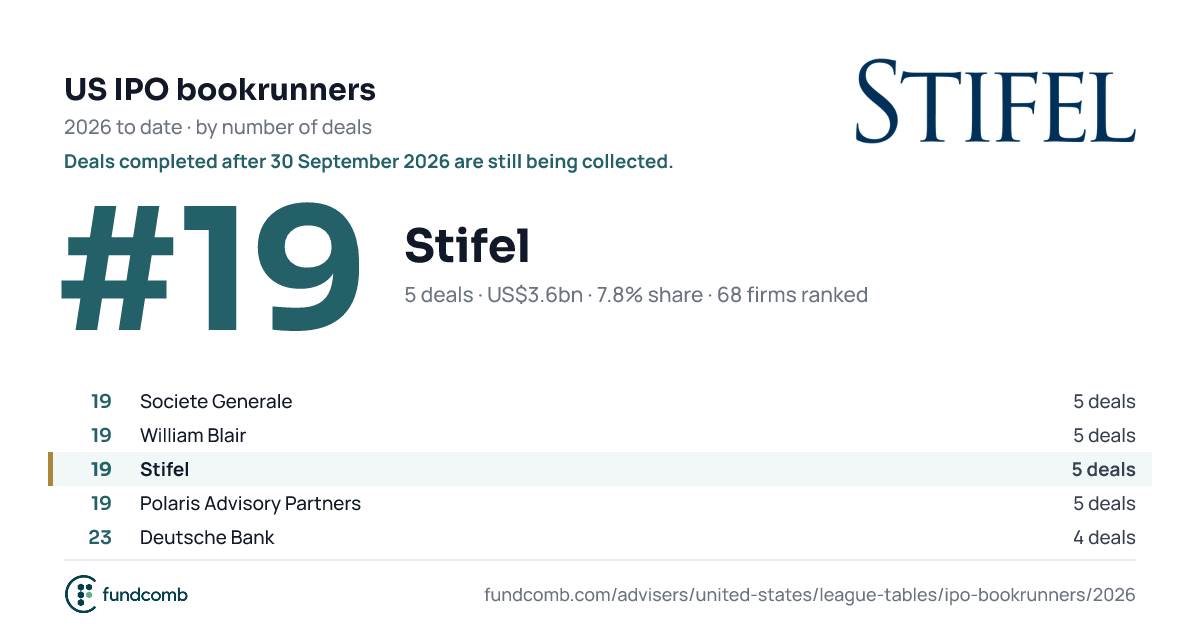
| 19 | Stifel US$3.6bn · 7.8% share · new | 3,600.2 | 7.8% | New | |
| |||||
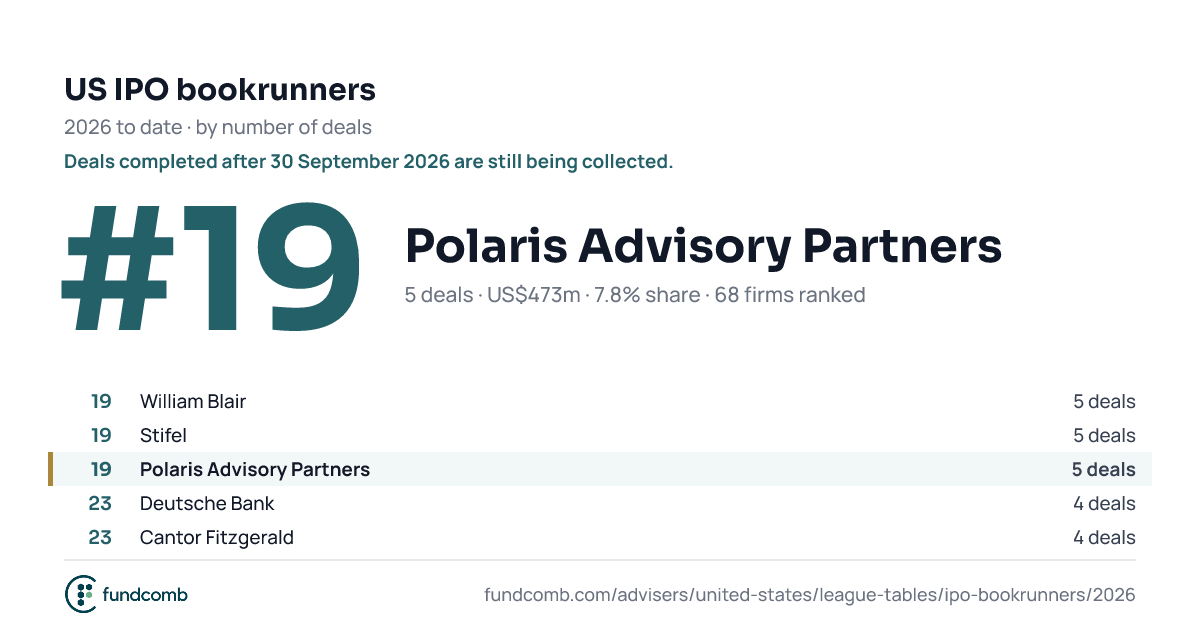
| 19 | Polaris Advisory Partners US$473m · 7.8% share · new | 472.5 | 7.8% | New | |
| |||||
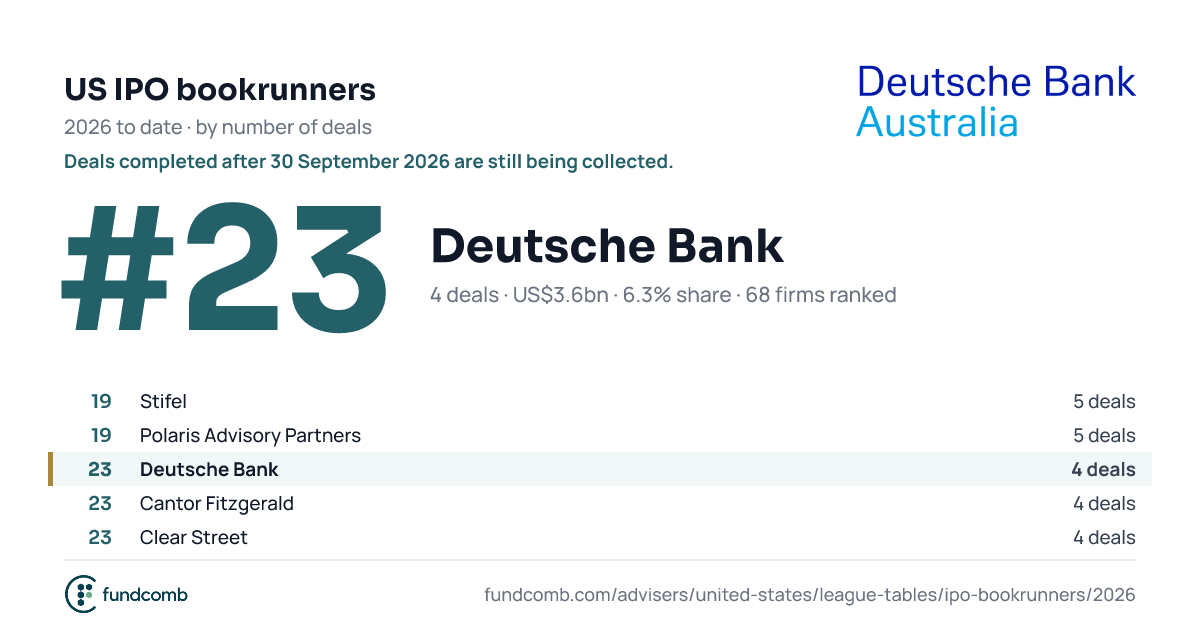
| 23 | Deutsche Bank US$3.6bn · 6.3% share · new | 3,575.3 | 6.3% | New | |
| |||||
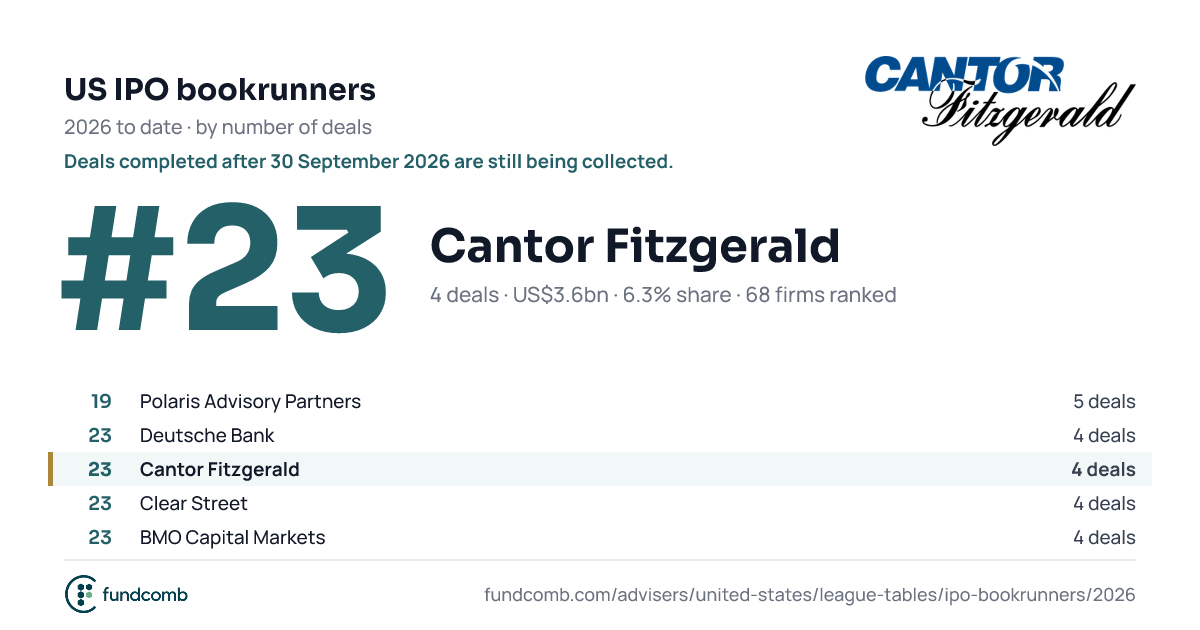
| 23 | Cantor Fitzgerald US$3.6bn · 6.3% share · was #1 | 3,559.1 | 6.3% | 1 , down 22 places | |
| |||||
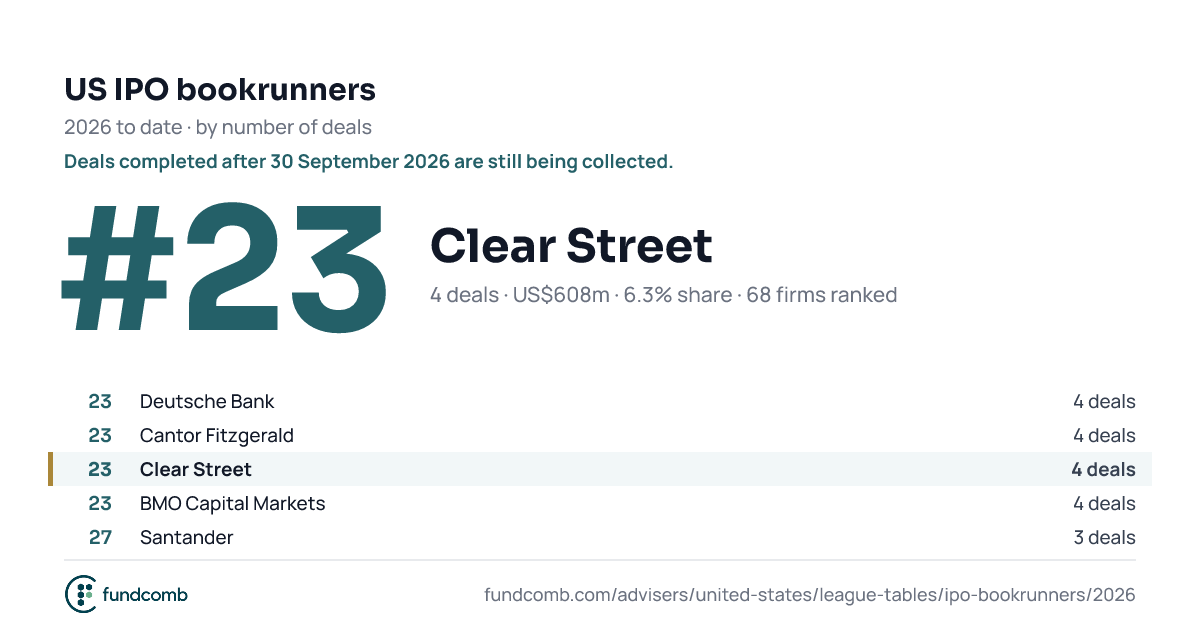
| 23 | Clear Street US$608m · 6.3% share · new | 607.5 | 6.3% | New | |
| |||||
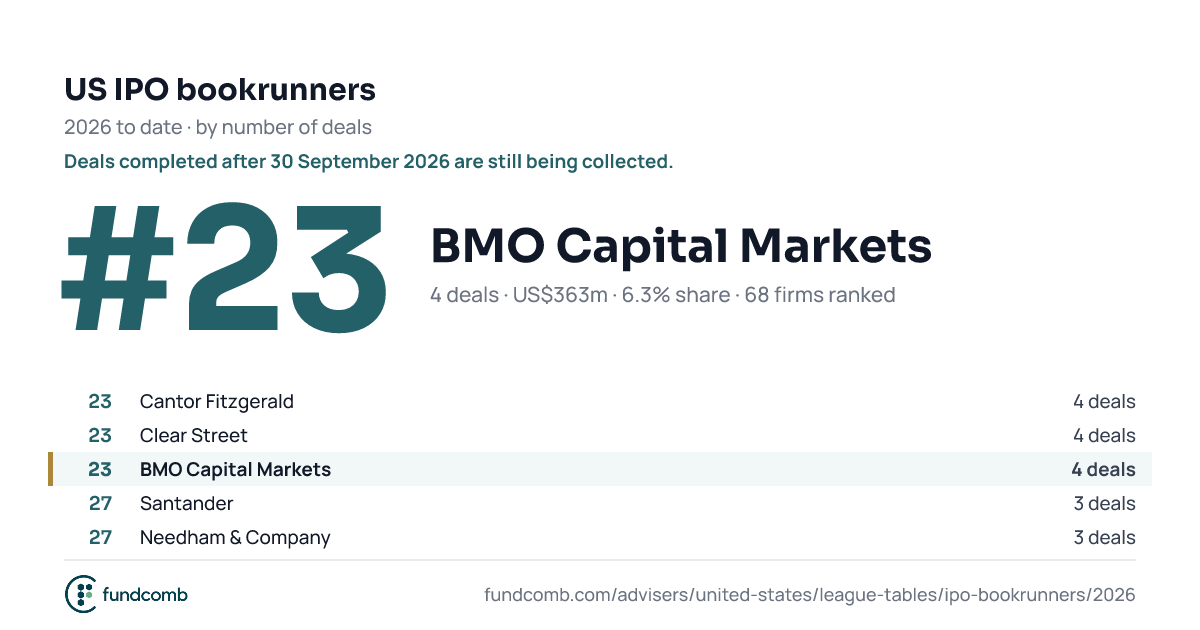
| 23 | BMO Capital Markets US$363m · 6.3% share · new | 363.4 | 6.3% | New | |
| |||||
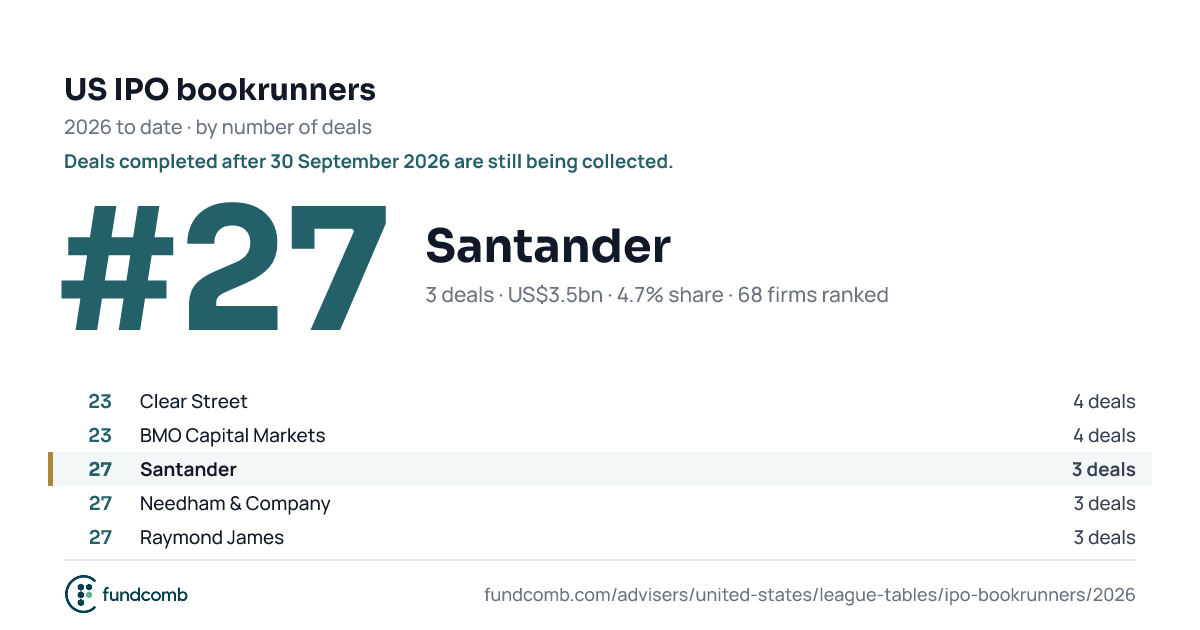
| 27 | Santander US$3.5bn · 4.7% share · new | 3,541.0 | 4.7% | New | |
| |||||
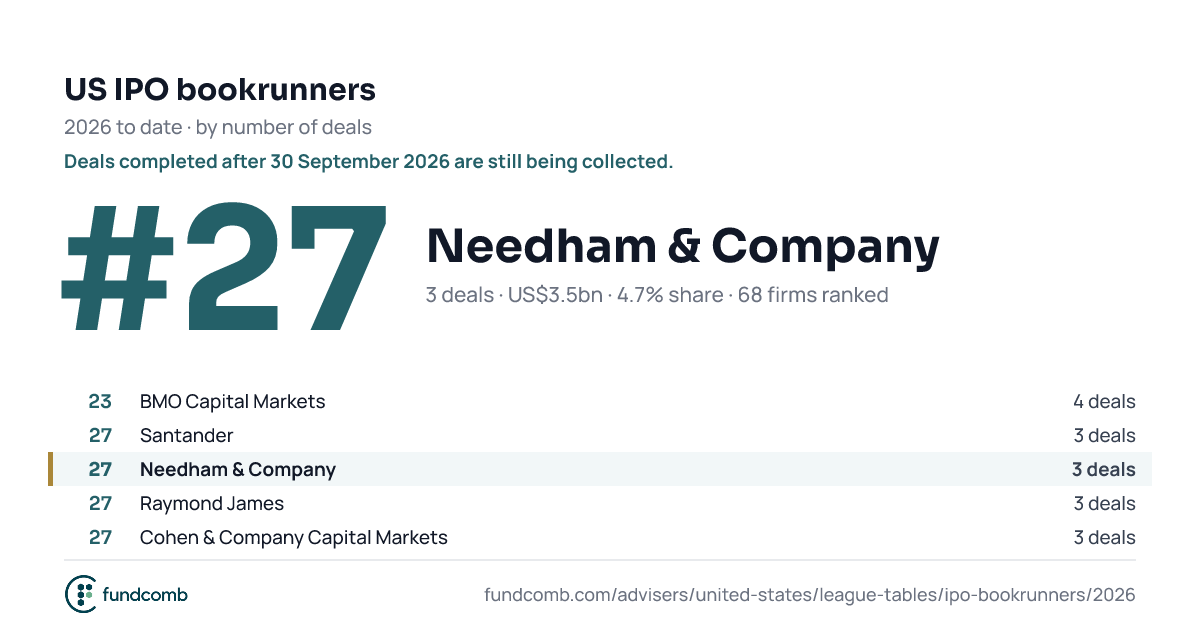
| 27 | Needham & Company US$3.5bn · 4.7% share · new | 3,482.6 | 4.7% | New | |
| |||||
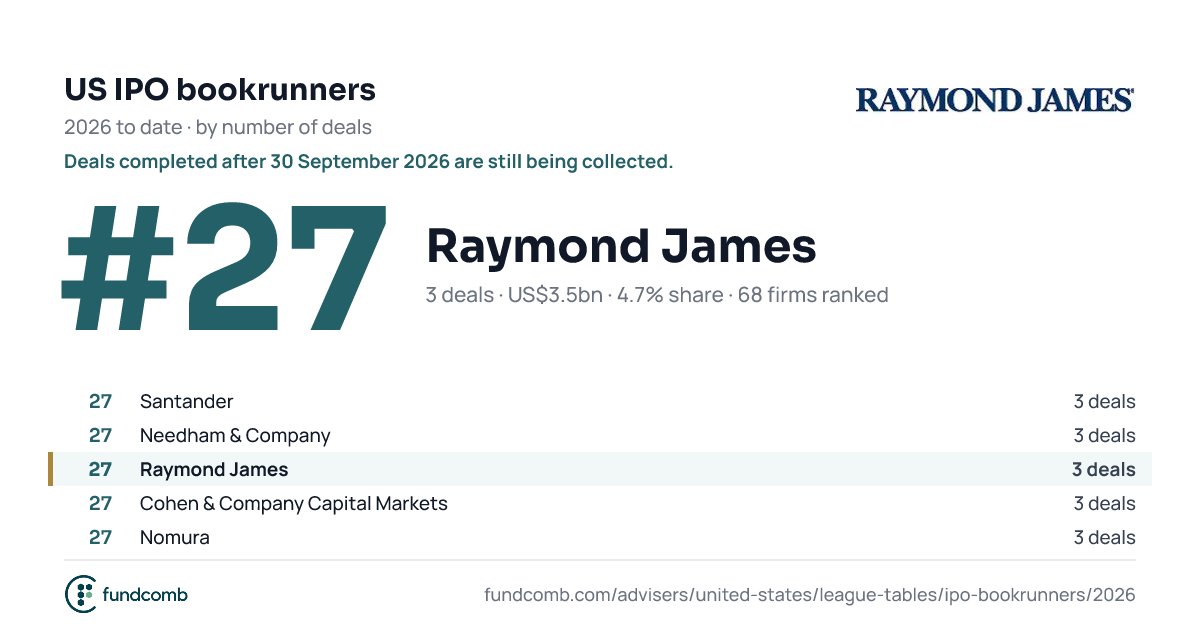
| 27 | Raymond James US$3.5bn · 4.7% share · new | 3,478.1 | 4.7% | New | |
| |||||
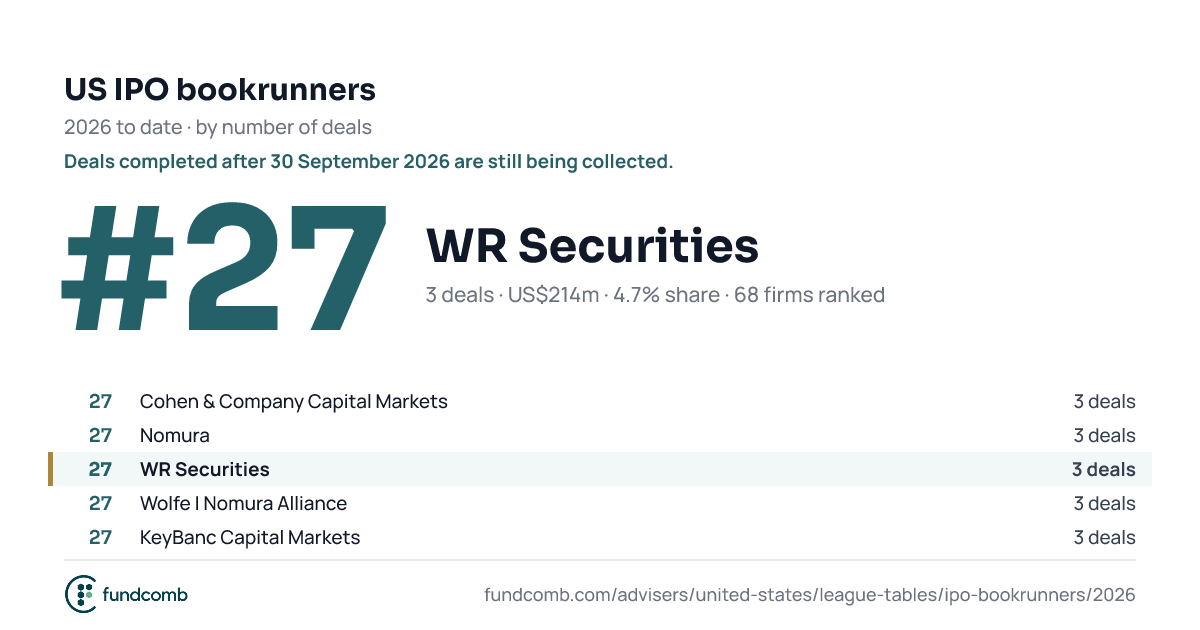
| 27 | Cohen & Company Capital Markets US$326m · 4.7% share · new | 325.5 | 4.7% | New | |
| |||||
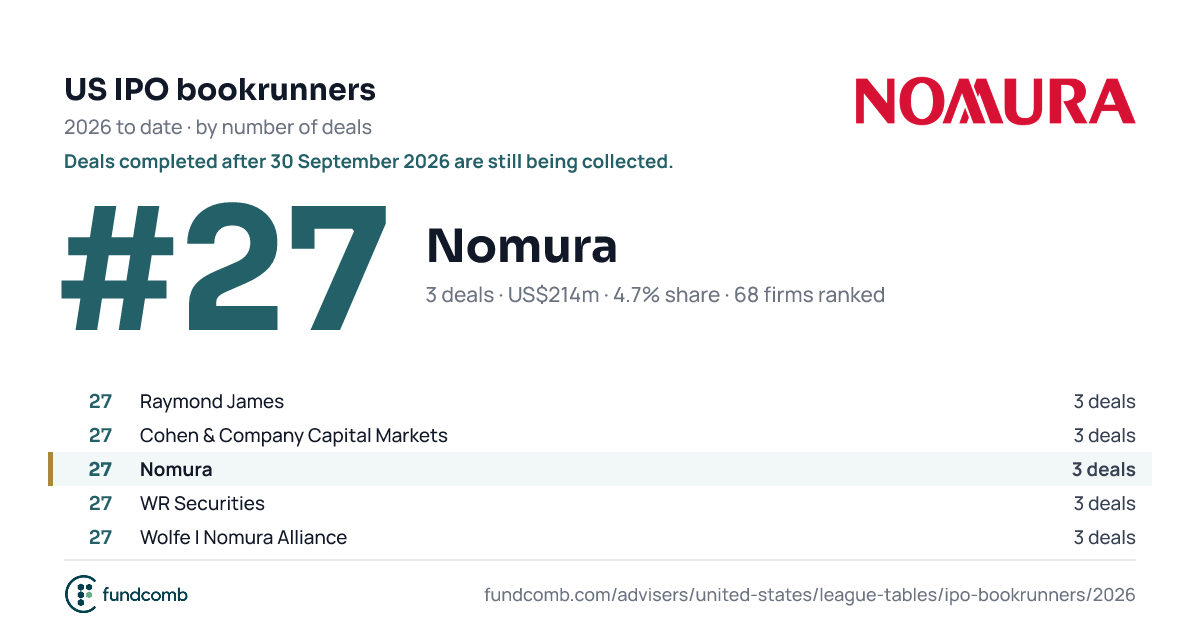
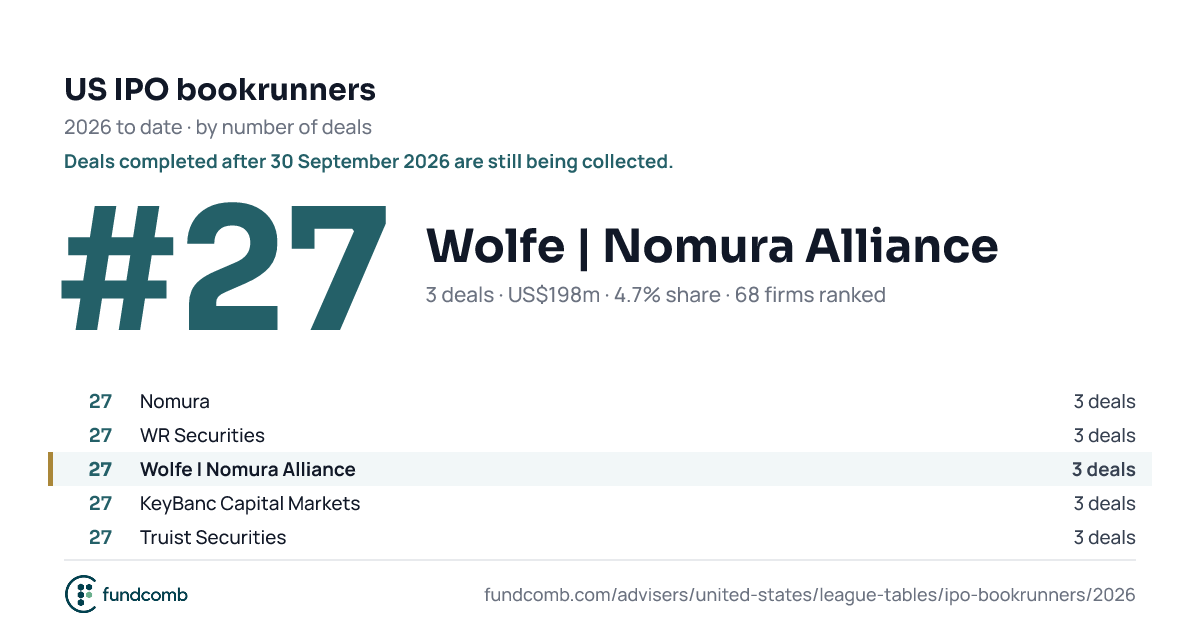
| 27 | Nomura US$214m · 4.7% share · new | 214.4 | 4.7% | New | |
| |||||
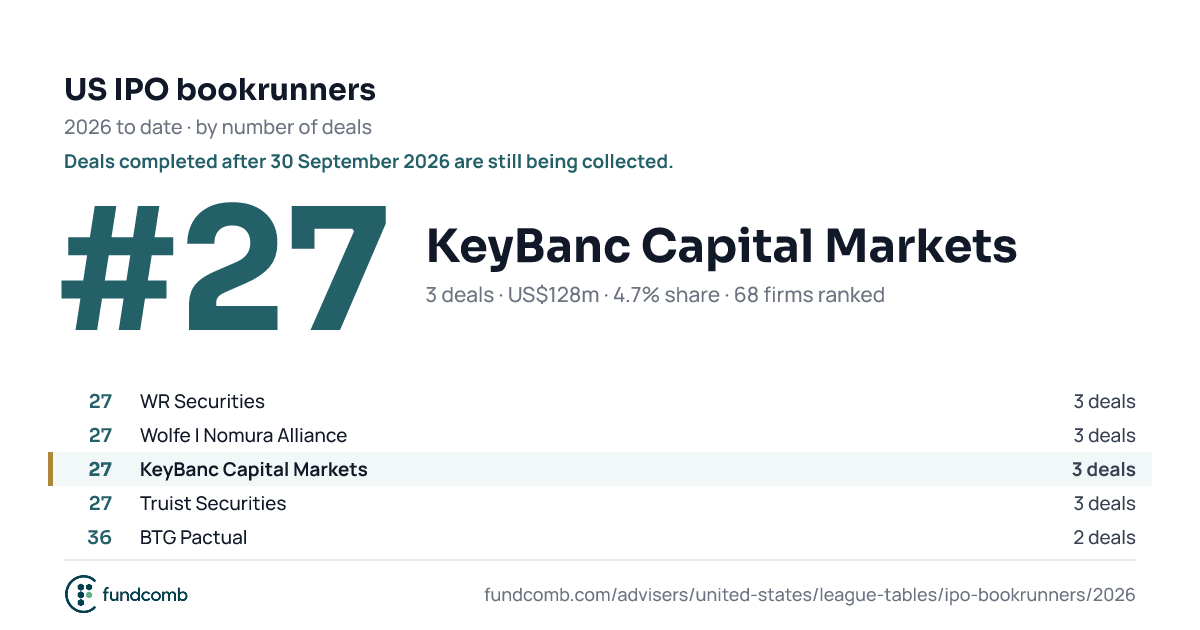
| 27 | WR Securities US$214m · 4.7% share · new | 214.4 | 4.7% | New | |
| |||||
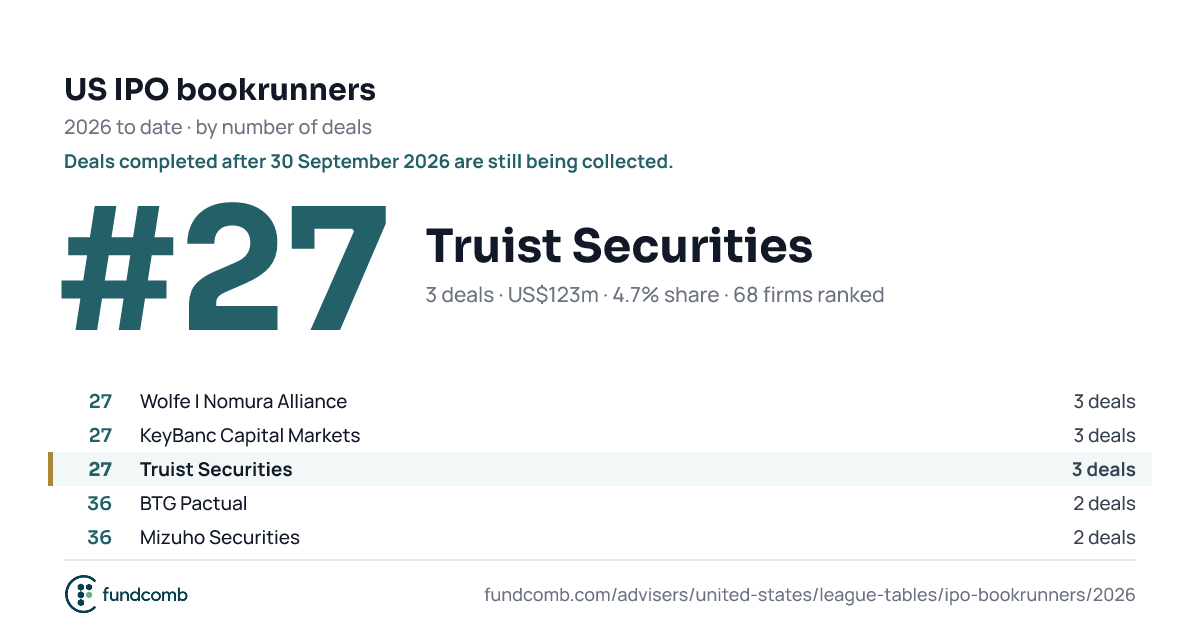
| 27 | Wolfe | Nomura Alliance US$198m · 4.7% share · new | 197.9 | 4.7% | New | |
| |||||
| 27 | KeyBanc Capital Markets US$128m · 4.7% share · new | 128.0 | 4.7% | New | |
| |||||
| 27 | Truist Securities US$123m · 4.7% share · new | 123.1 | 4.7% | New | |
| |||||
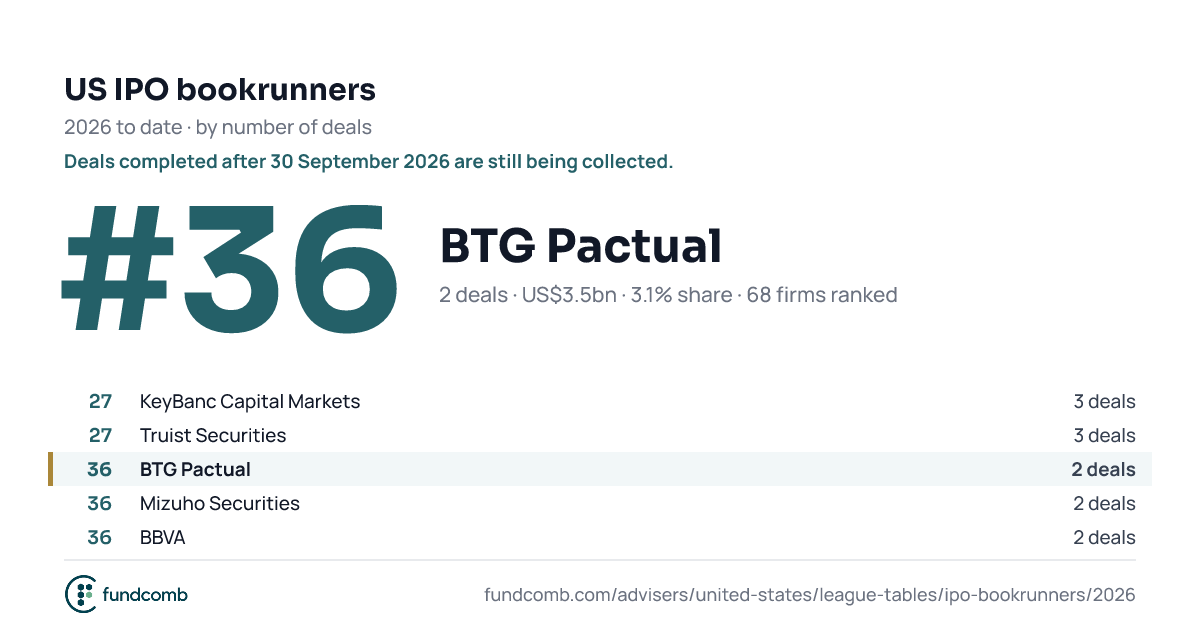
| 36 | BTG Pactual US$3.5bn · 3.1% share · new | 3,457.3 | 3.1% | New | |
| |||||
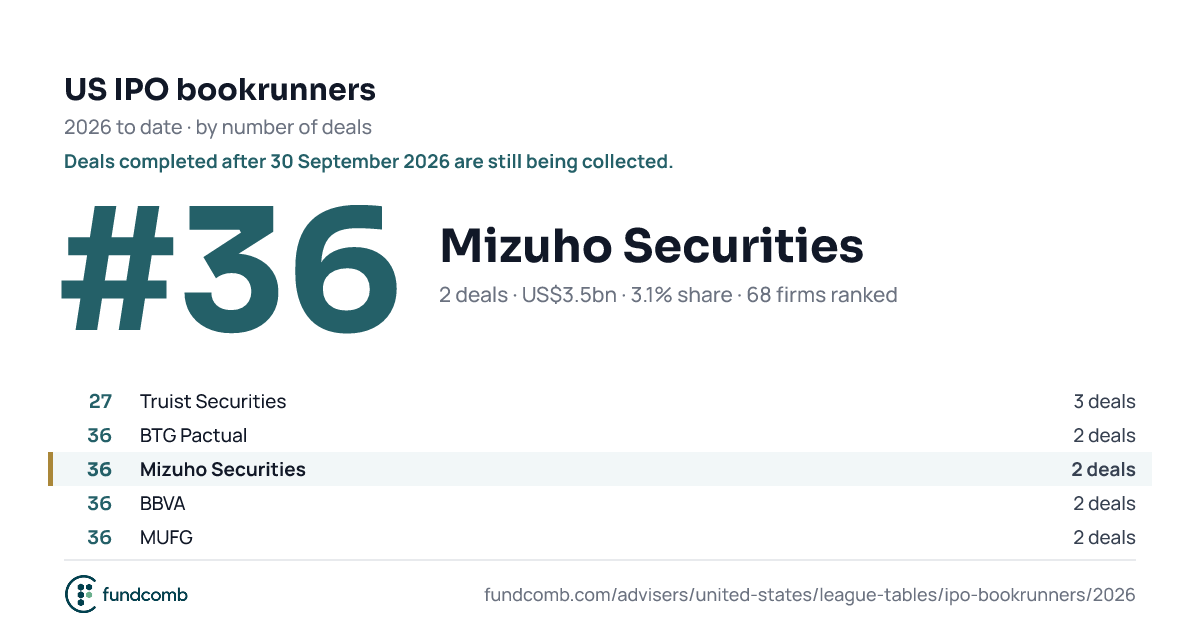
| 36 | Mizuho Securities US$3.5bn · 3.1% share · new | 3,450.8 | 3.1% | New | |
| |||||
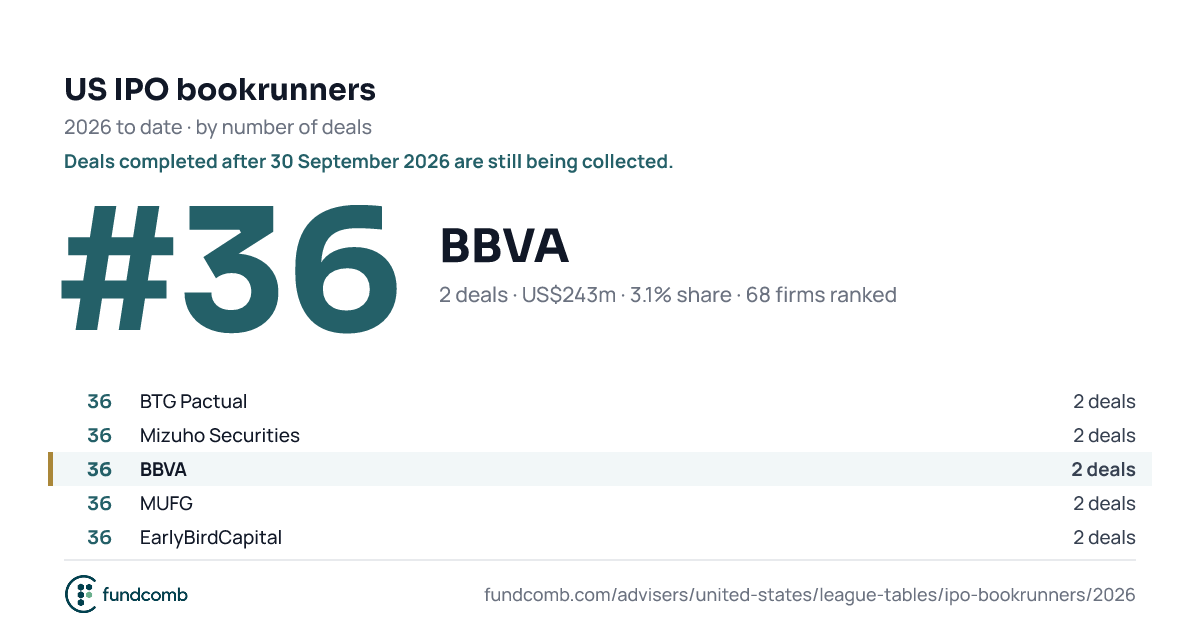
| 36 | BBVA US$243m · 3.1% share · new | 242.6 | 3.1% | New | |
| |||||
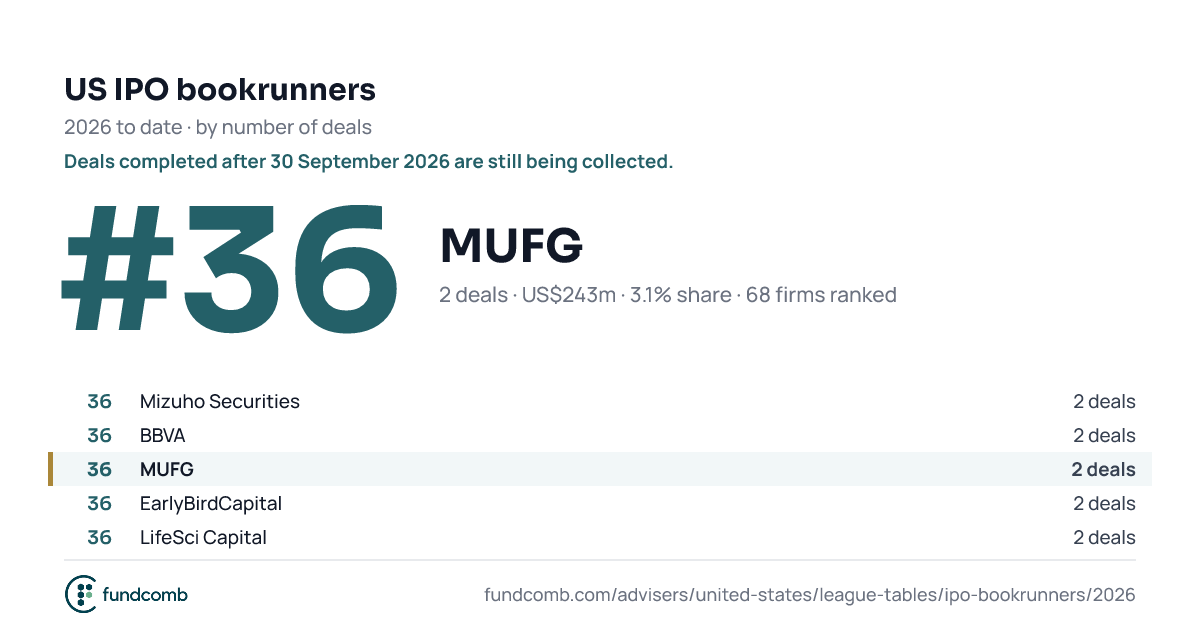
| 36 | MUFG US$243m · 3.1% share · new | 242.6 | 3.1% | New | |
| |||||
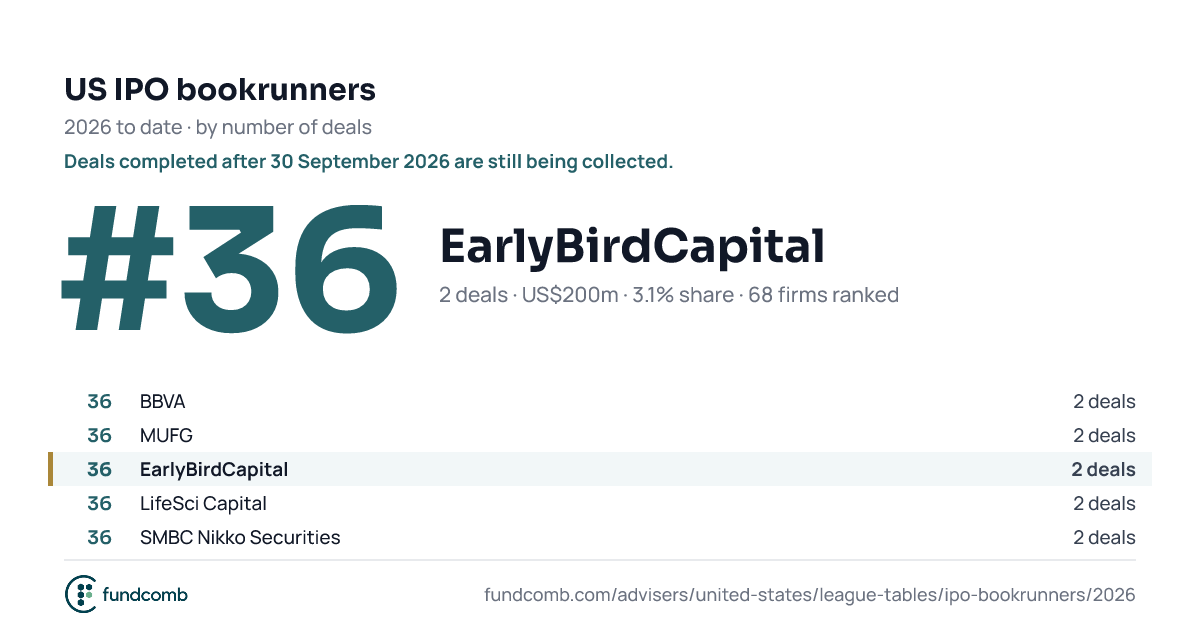
| 36 | EarlyBirdCapital US$200m · 3.1% share · new | 200.0 | 3.1% | New | |
| |||||
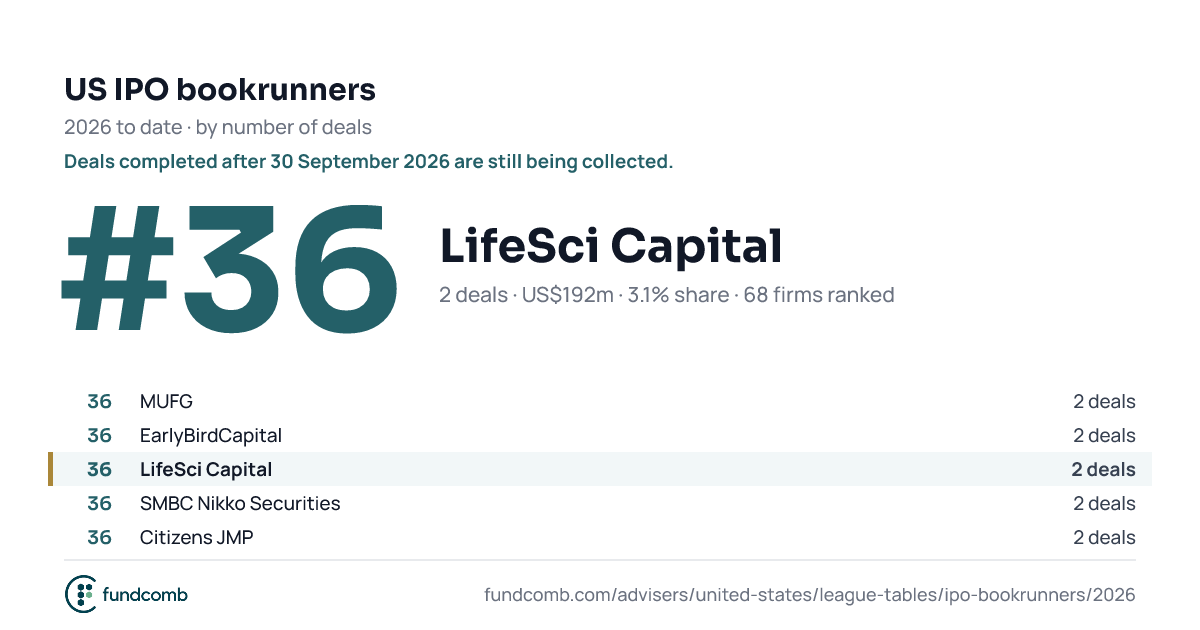
| 36 | LifeSci Capital US$192m · 3.1% share · new | 191.8 | 3.1% | New | |
| |||||
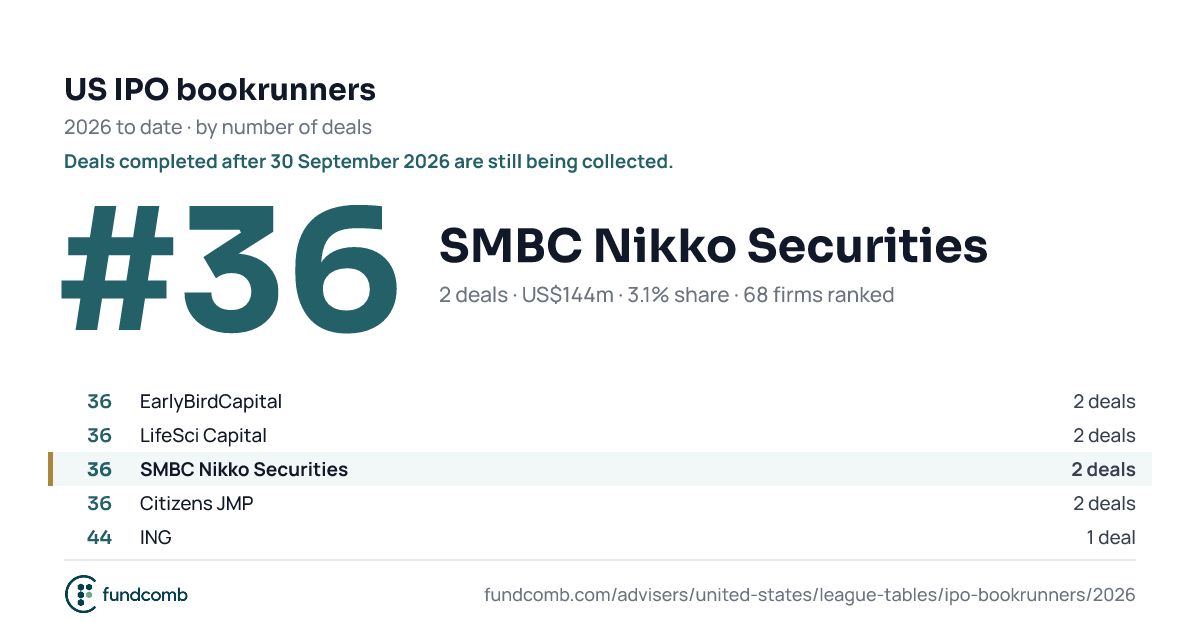
| 36 | SMBC Nikko Securities US$144m · 3.1% share · new | 143.9 | 3.1% | New | |
| |||||
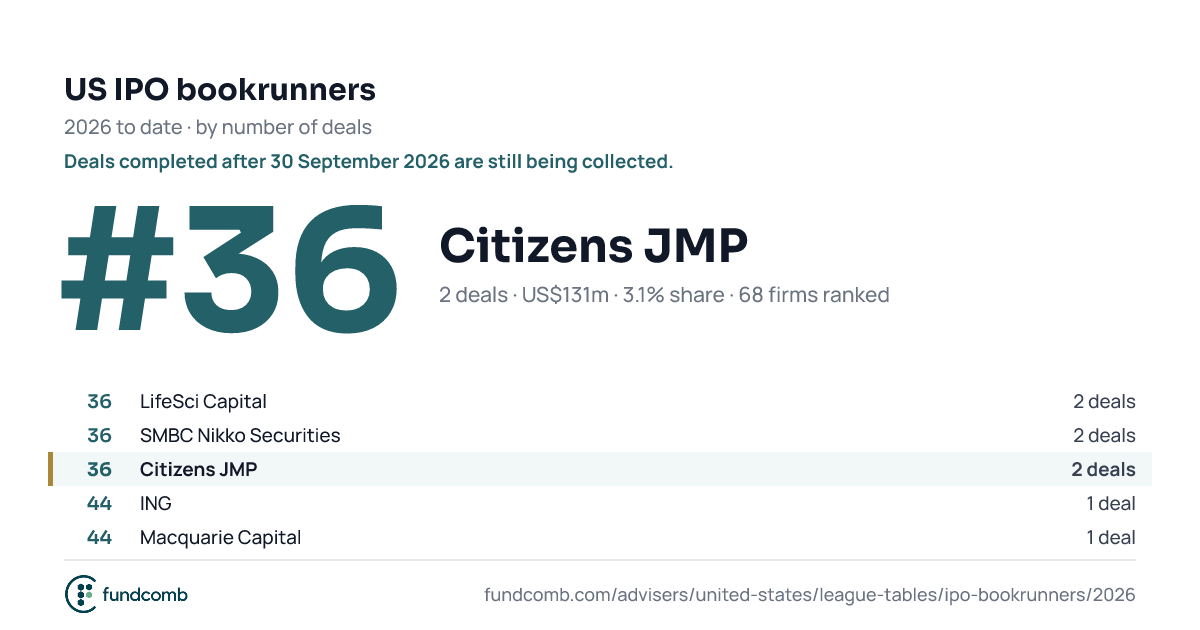
| 36 | Citizens JMP US$131m · 3.1% share · new | 130.9 | 3.1% | New | |
| |||||
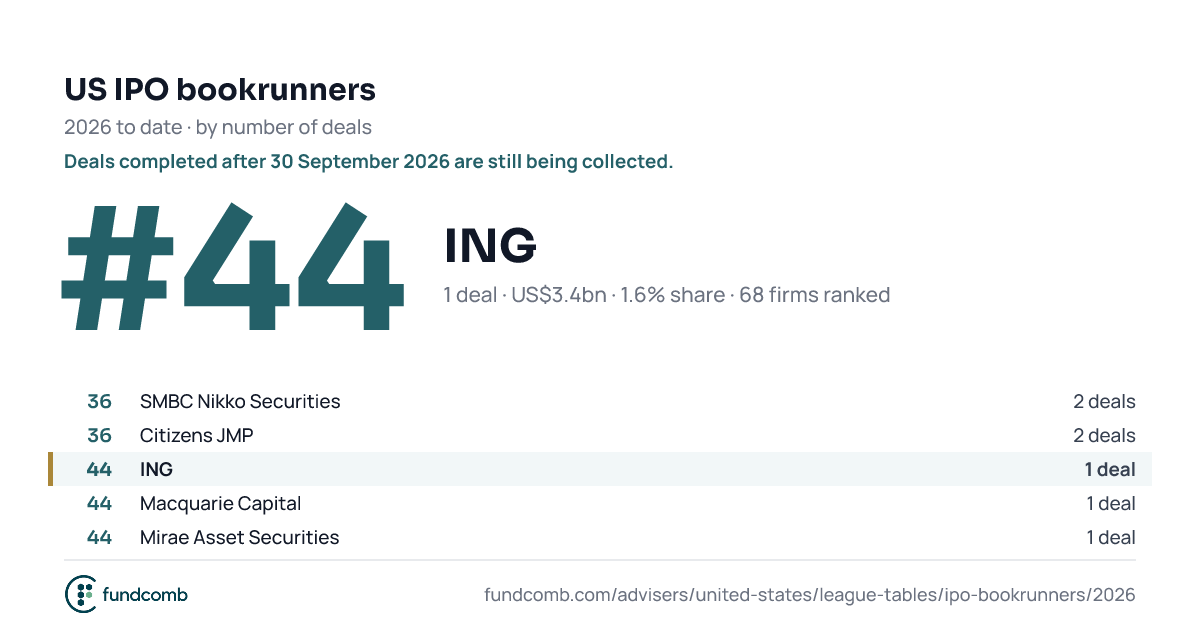
| 44 | ING US$3.4bn · 1.6% share · new | 3,409.1 | 1.6% | New | |
| |||||
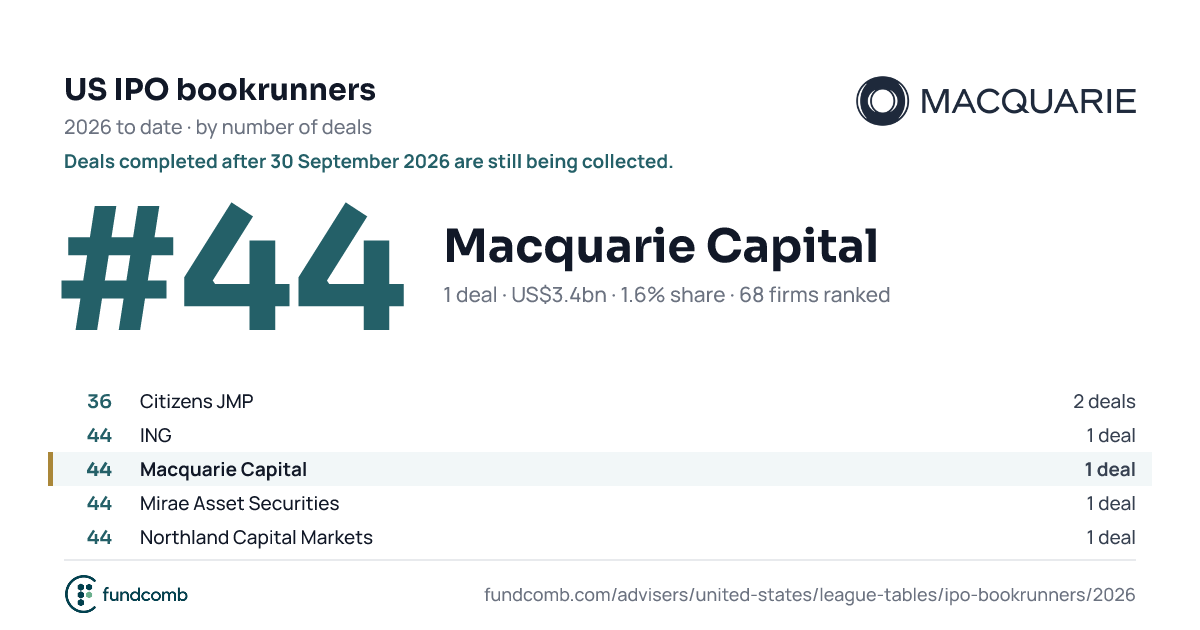
| 44 | Macquarie Capital US$3.4bn · 1.6% share · new | 3,409.1 | 1.6% | New | |
| |||||
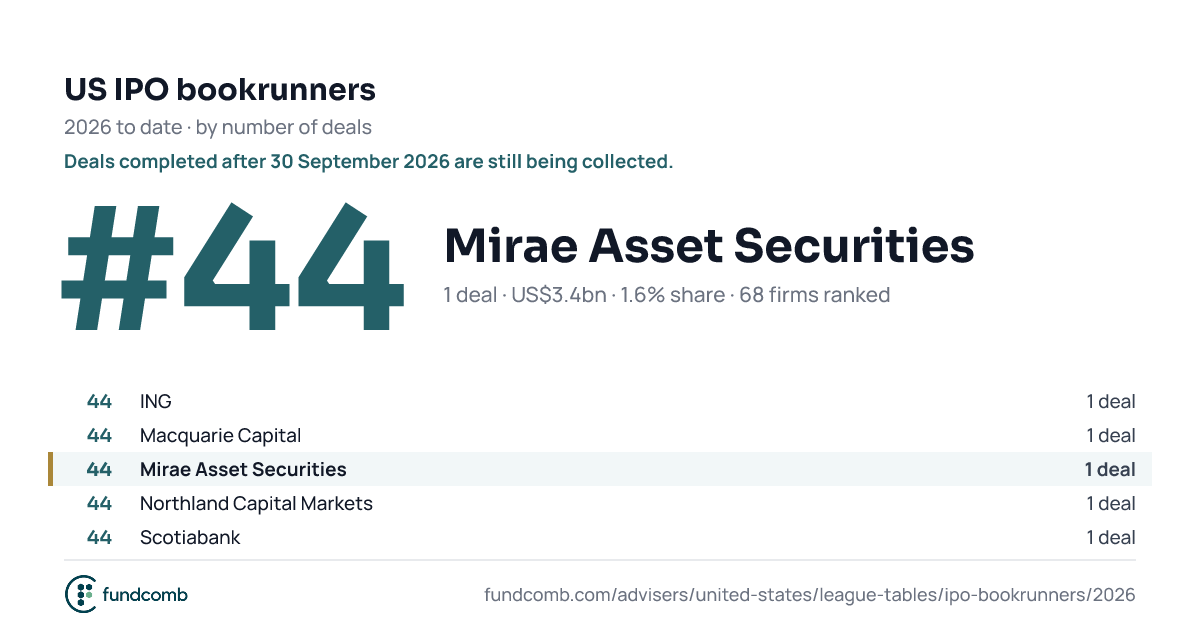
| 44 | Mirae Asset Securities US$3.4bn · 1.6% share · new | 3,409.1 | 1.6% | New | |
| |||||
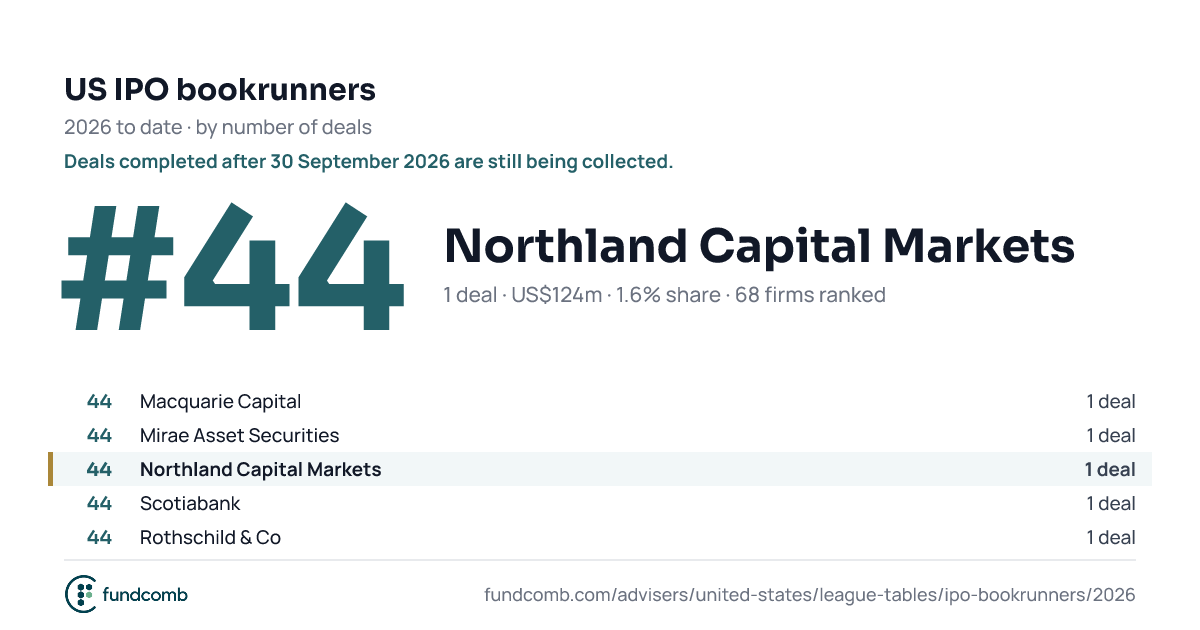
| 44 | Northland Capital Markets US$124m · 1.6% share · new | 124.3 | 1.6% | New | |
| |||||
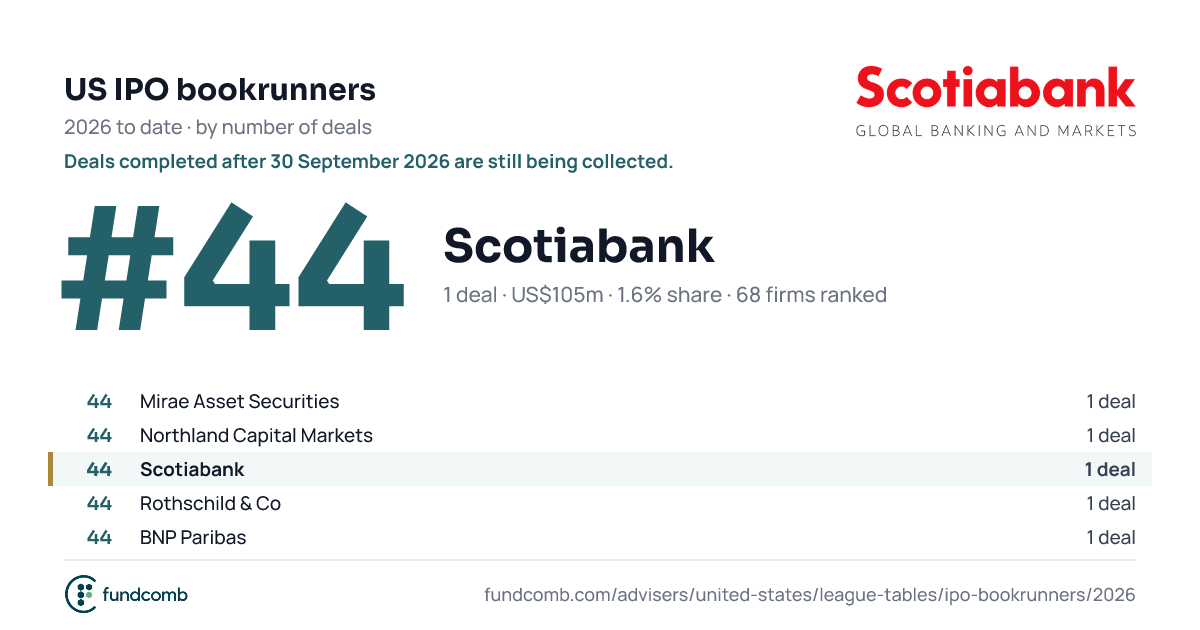
| 44 | Scotiabank US$105m · 1.6% share · new | 105.0 | 1.6% | New | |
| |||||
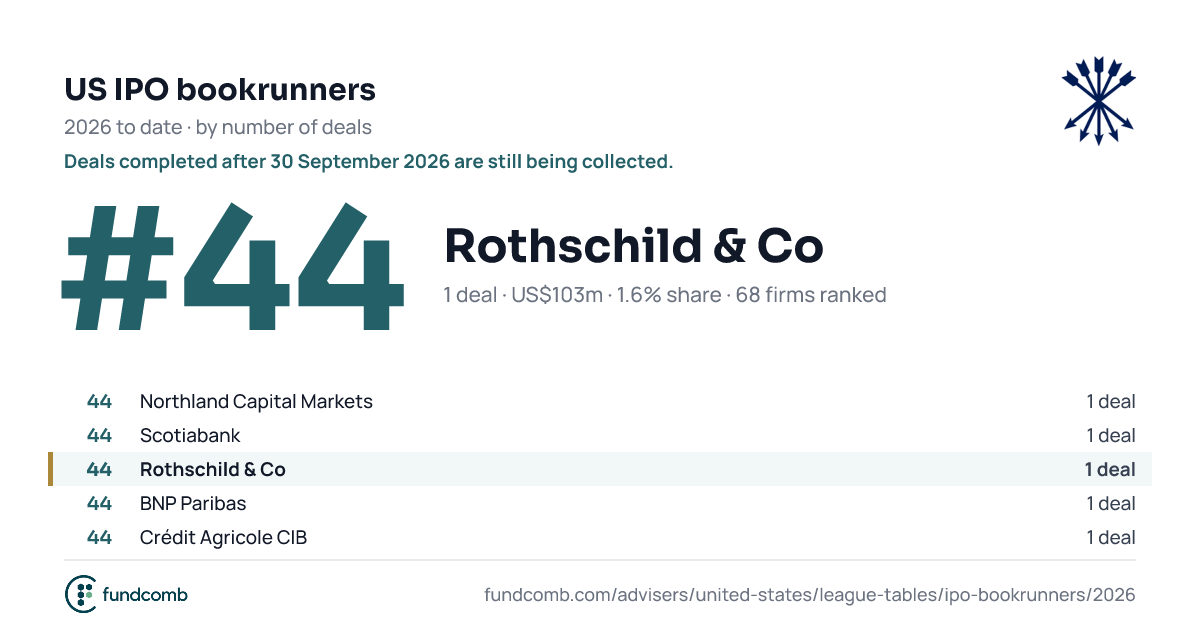
| 44 | Rothschild & Co US$103m · 1.6% share · new | 103.1 | 1.6% | New | |
| |||||
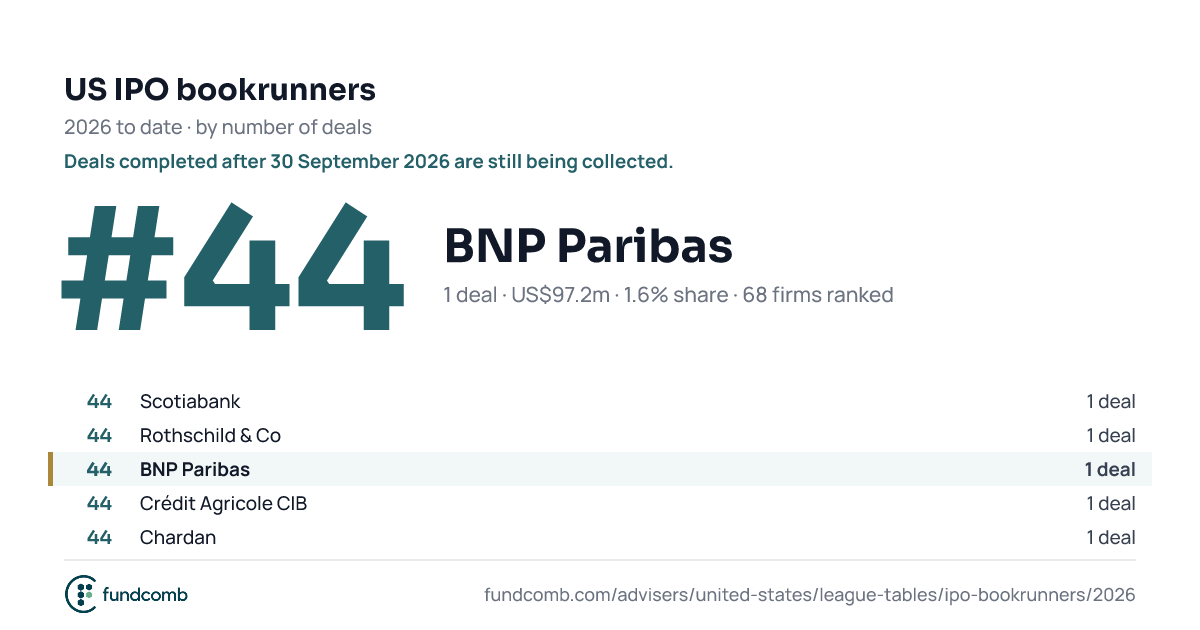
| 44 | BNP Paribas US$97.2m · 1.6% share · new | 97.2 | 1.6% | New | |
| |||||
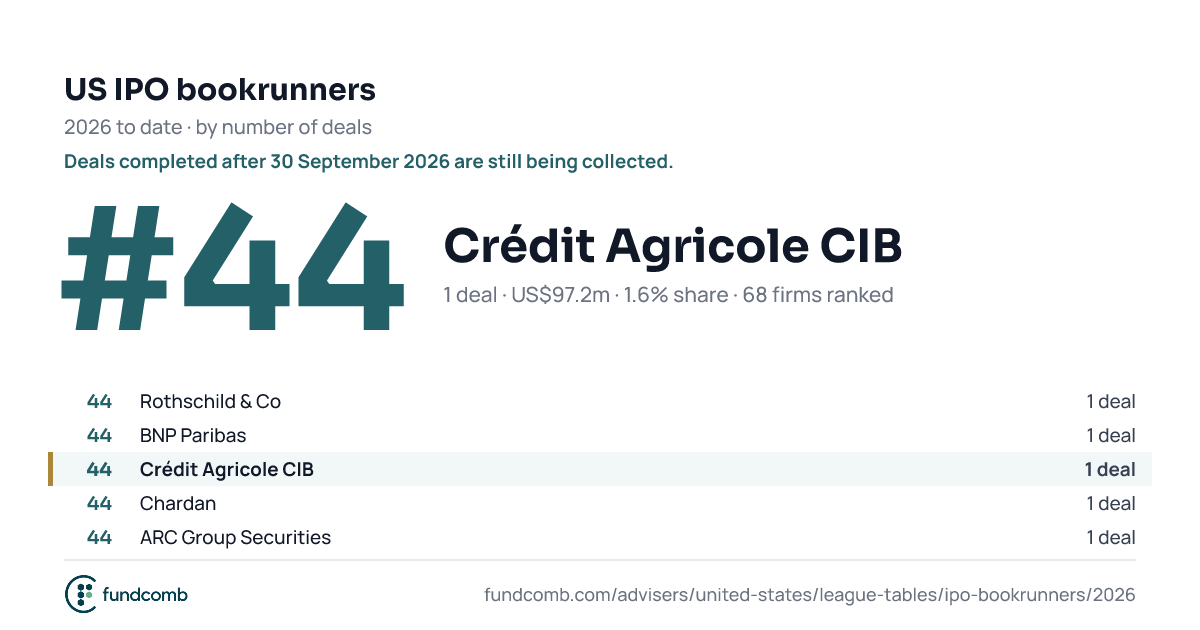
| 44 | Crédit Agricole CIB US$97.2m · 1.6% share · new | 97.2 | 1.6% | New | |
| |||||
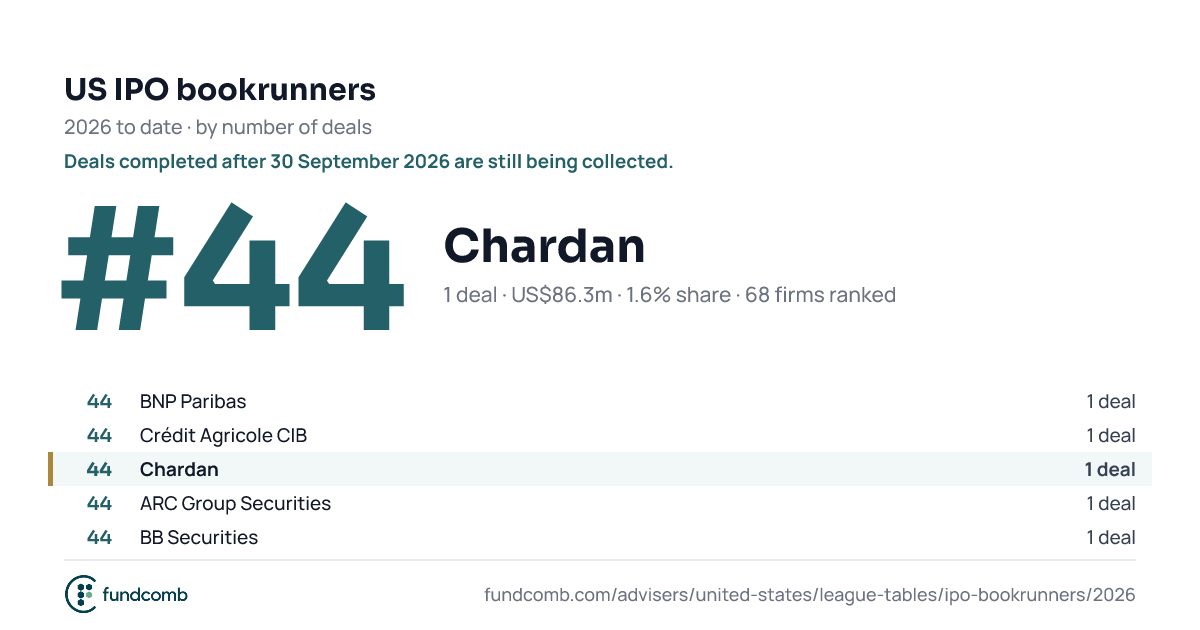
| 44 | Chardan US$86.3m · 1.6% share · new | 86.3 | 1.6% | New | |
| |||||
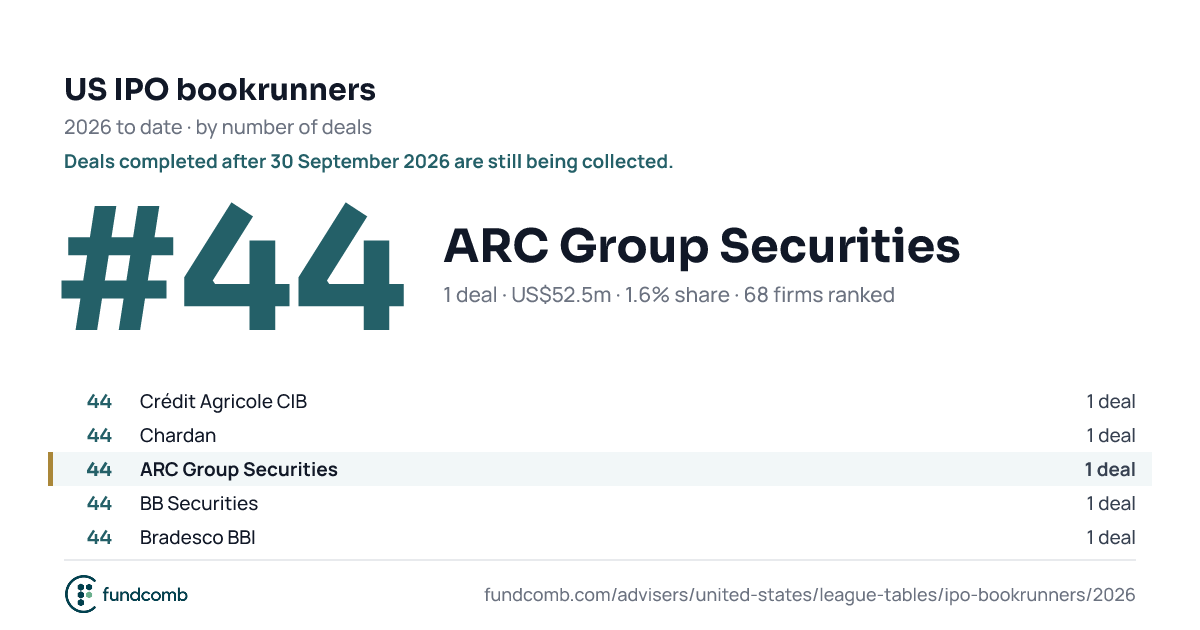
| 44 | ARC Group Securities US$52.5m · 1.6% share · new | 52.5 | 1.6% | New | |
| |||||
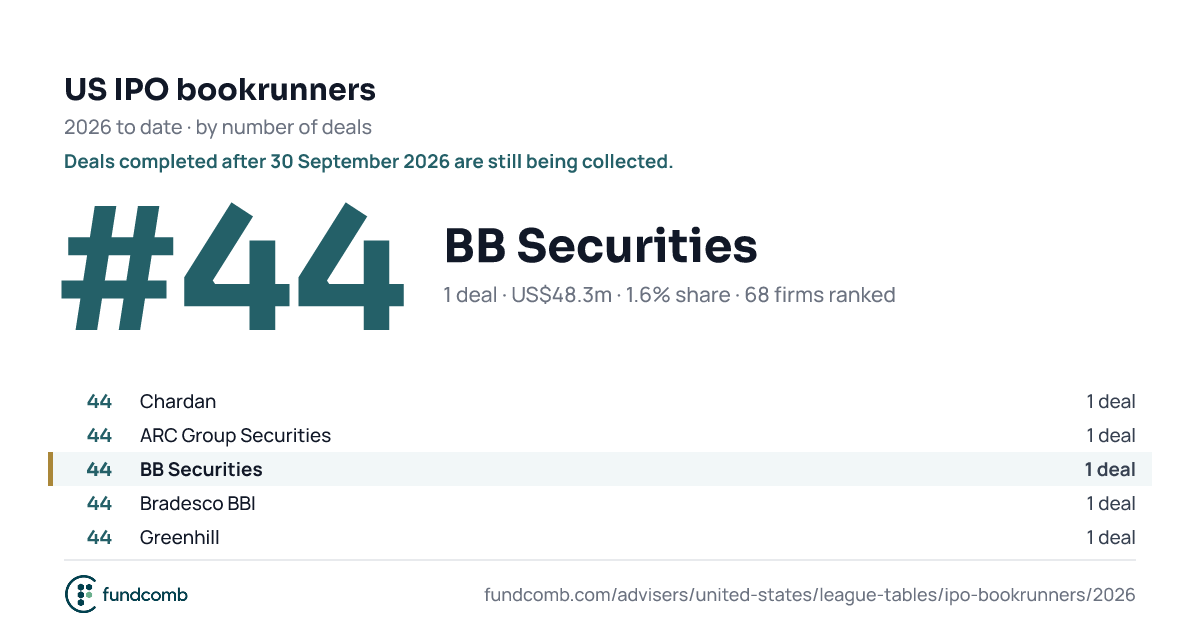
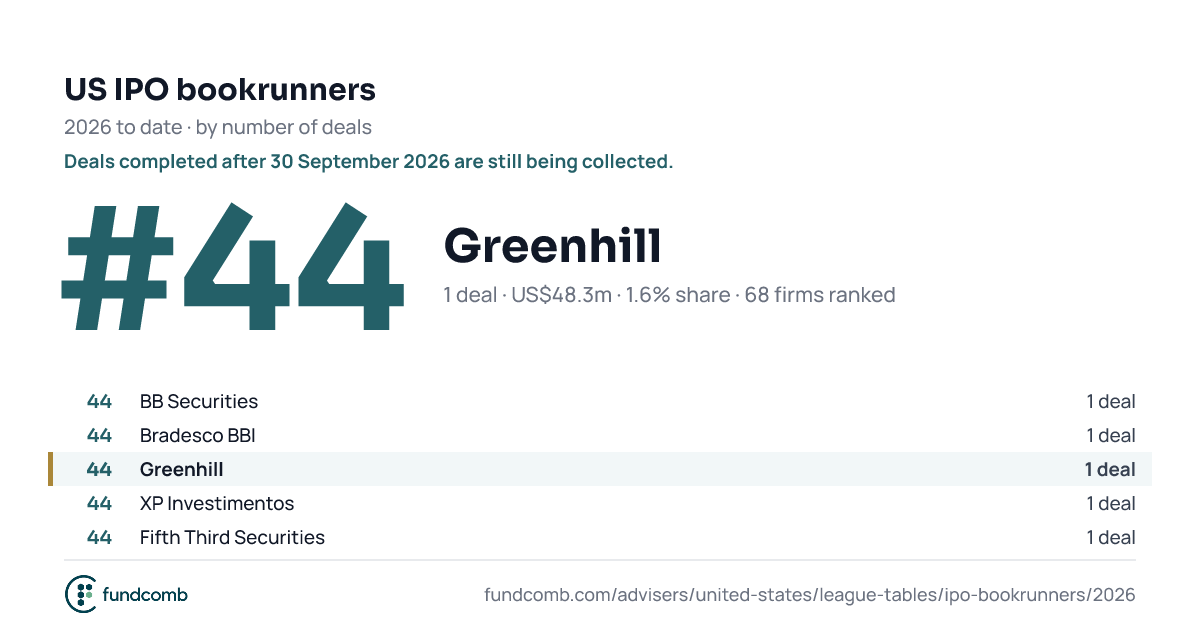
| 44 | BB Securities US$48.3m · 1.6% share · new | 48.3 | 1.6% | New | |
| |||||
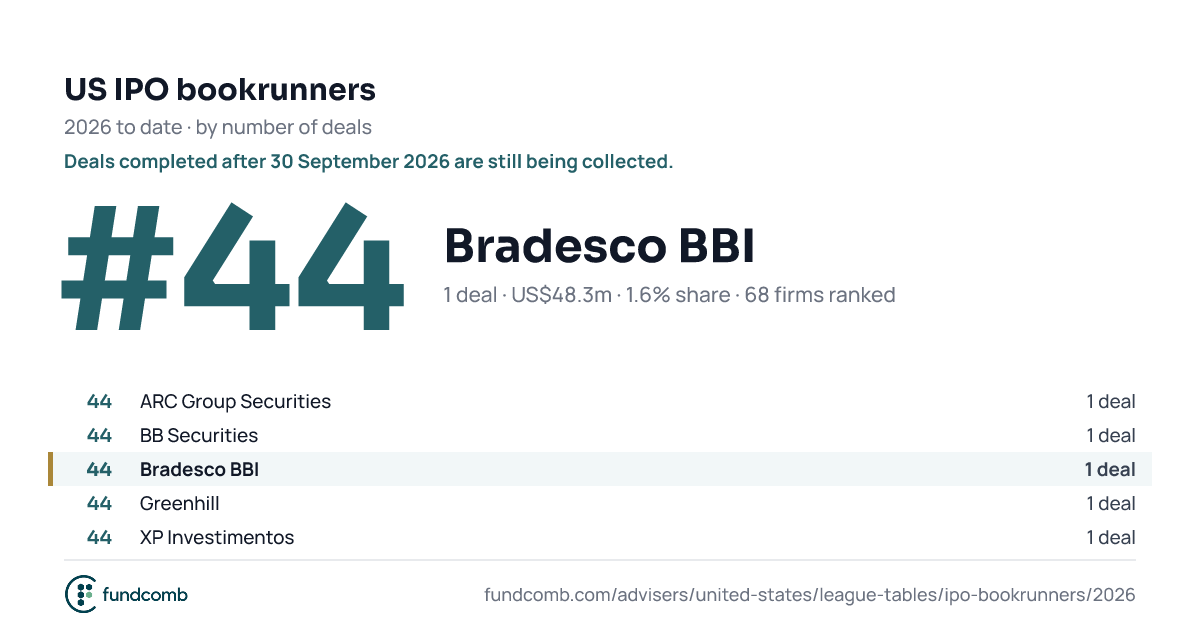
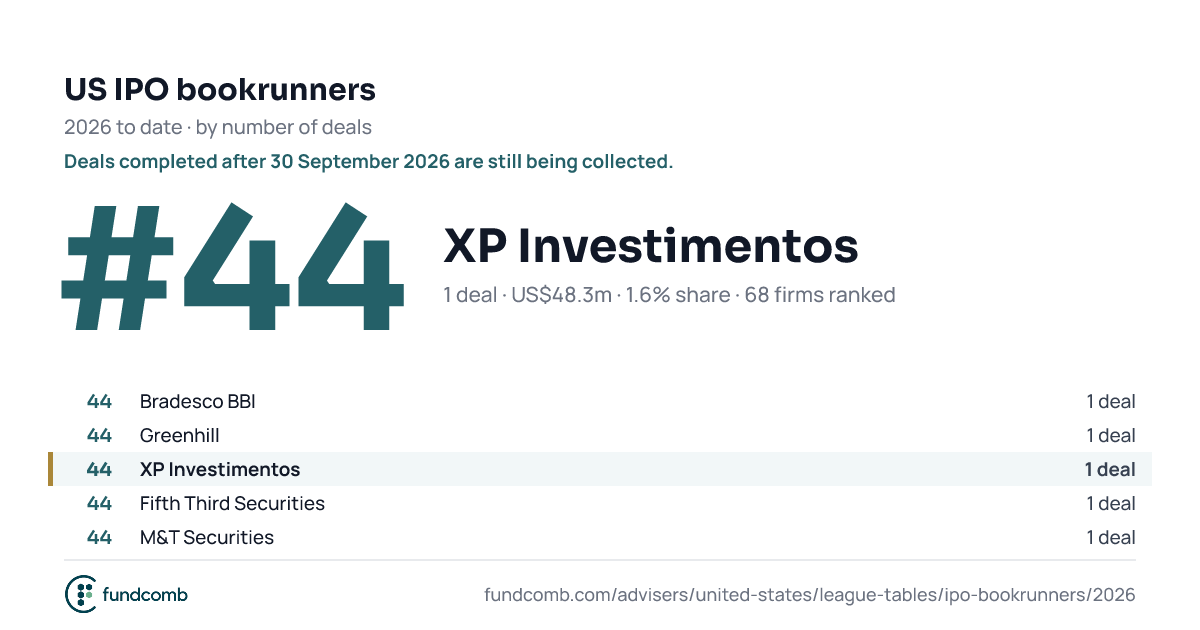
| 44 | Bradesco BBI US$48.3m · 1.6% share · new | 48.3 | 1.6% | New | |
| |||||
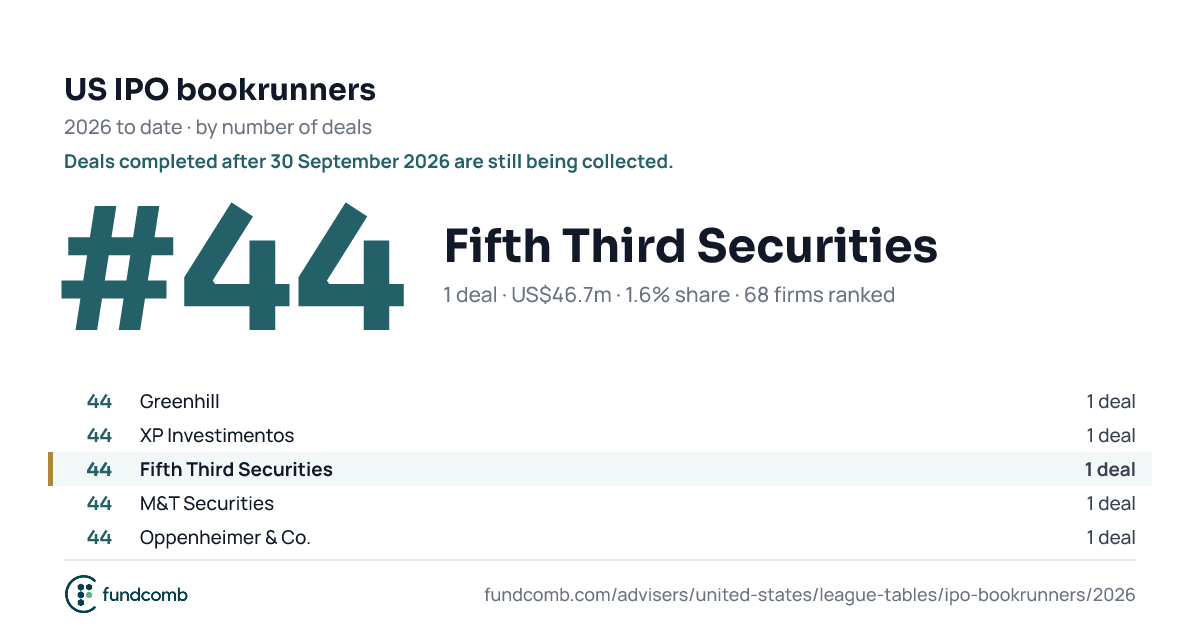
| 44 | Greenhill US$48.3m · 1.6% share · new | 48.3 | 1.6% | New | |
| |||||
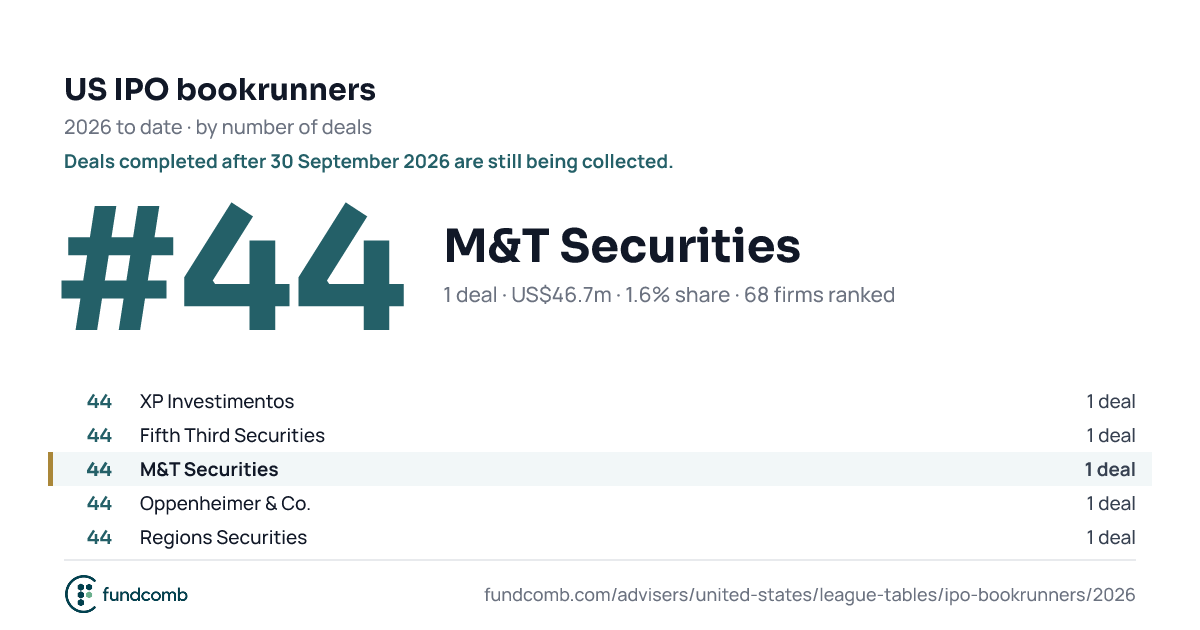
| 44 | XP Investimentos US$48.3m · 1.6% share · new | 48.3 | 1.6% | New | |
| |||||
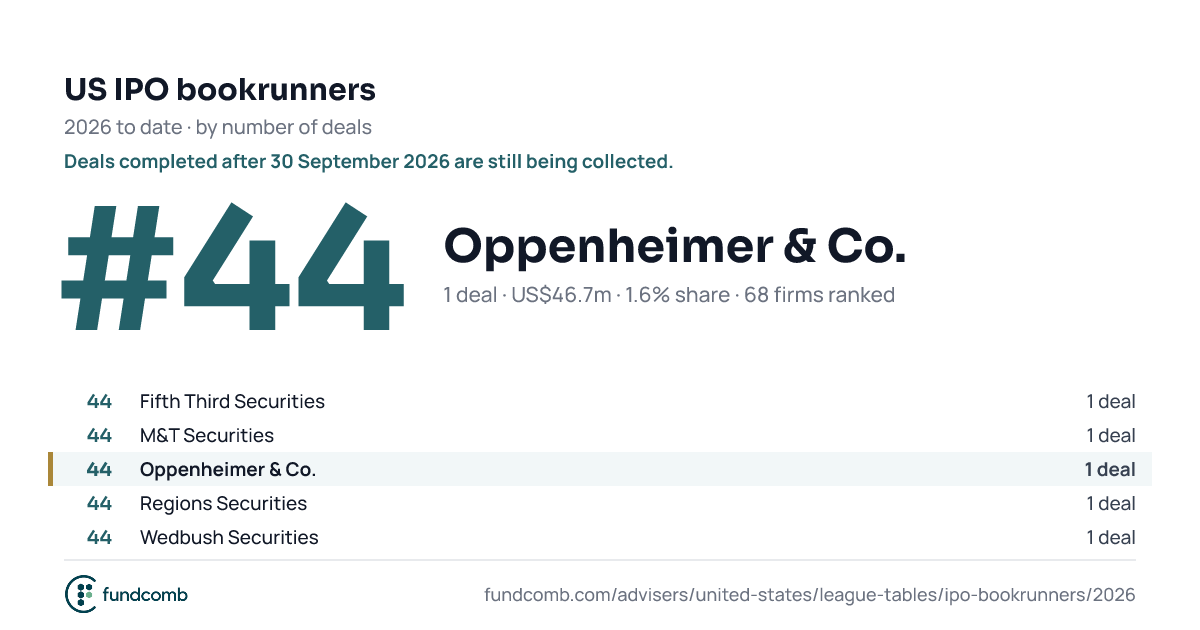
| 44 | Fifth Third Securities US$46.7m · 1.6% share · new | 46.7 | 1.6% | New | |
| |||||
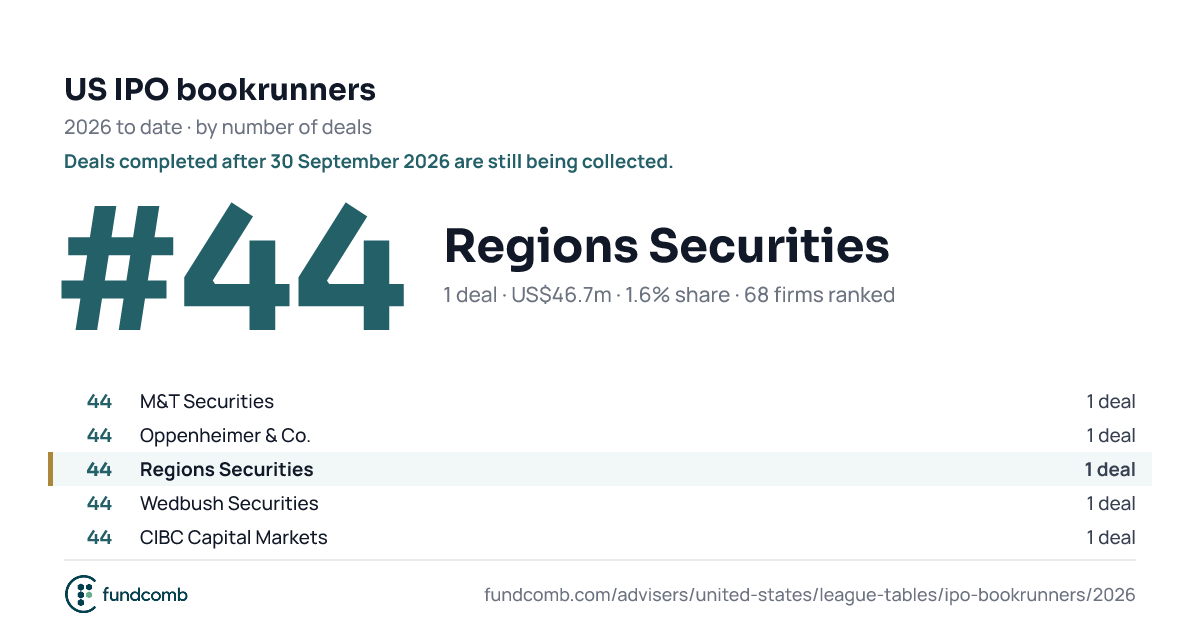
| 44 | M&T Securities US$46.7m · 1.6% share · new | 46.7 | 1.6% | New | |
| |||||
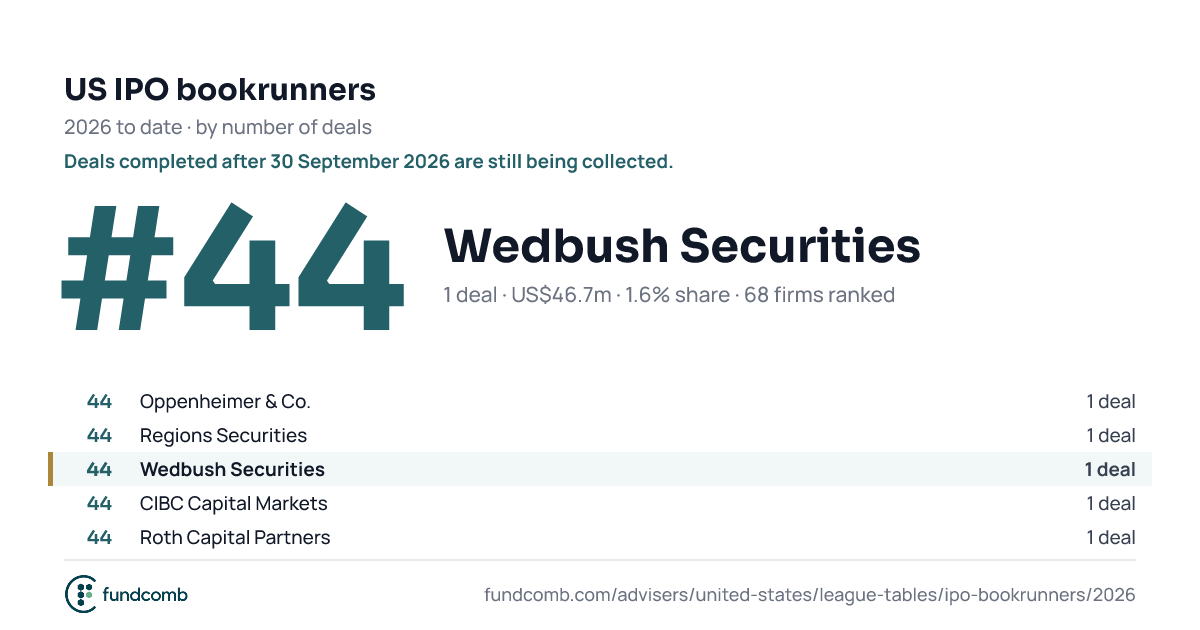
| 44 | Oppenheimer & Co. US$46.7m · 1.6% share · new | 46.7 | 1.6% | New | |
| |||||
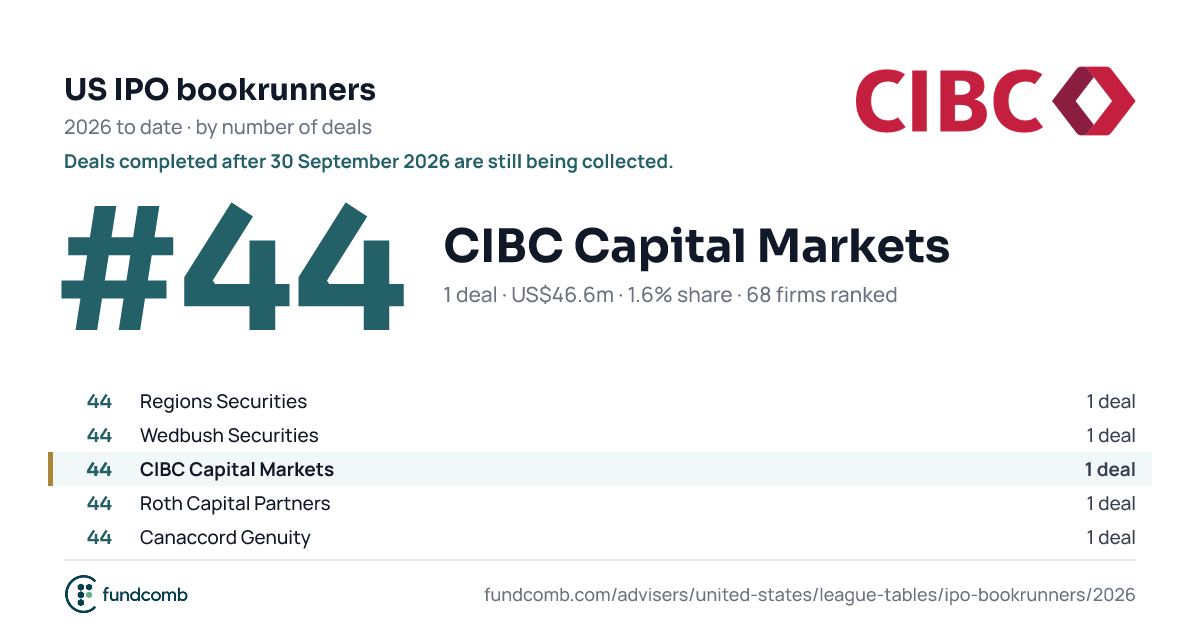
| 44 | Regions Securities US$46.7m · 1.6% share · new | 46.7 | 1.6% | New | |
| |||||
| 44 | Wedbush Securities US$46.7m · 1.6% share · new | 46.7 | 1.6% | New | |
| |||||
| 44 | CIBC Capital Markets US$46.6m · 1.6% share · new | 46.6 | 1.6% | New | |
| |||||
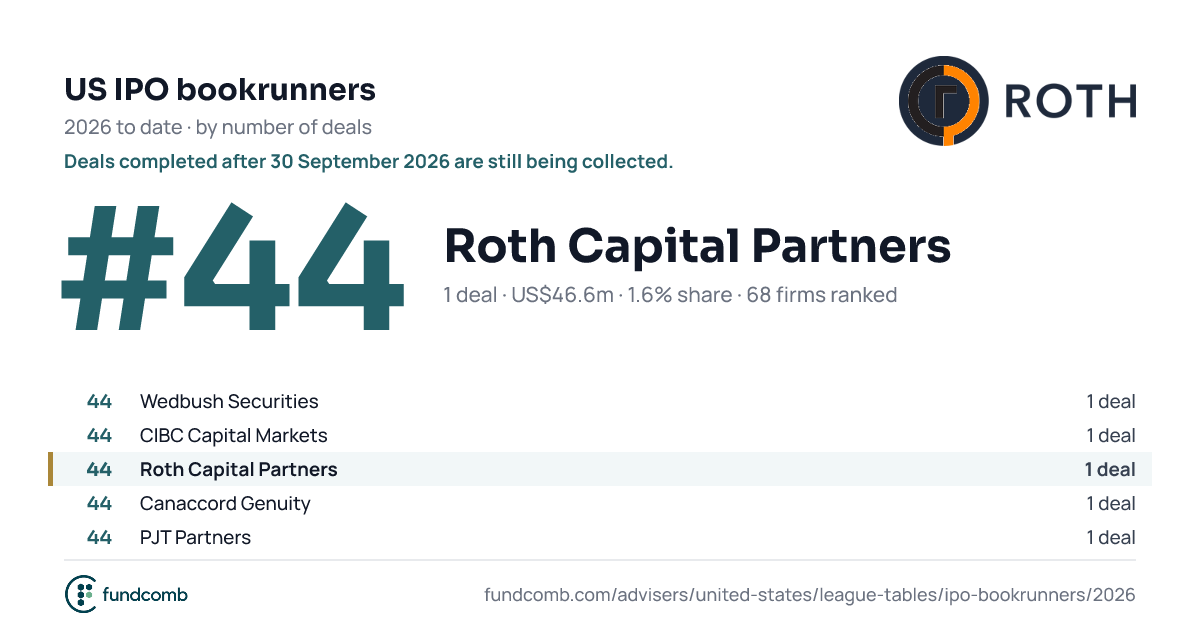
| 44 | Roth Capital Partners US$46.6m · 1.6% share · new | 46.6 | 1.6% | New | |
| |||||
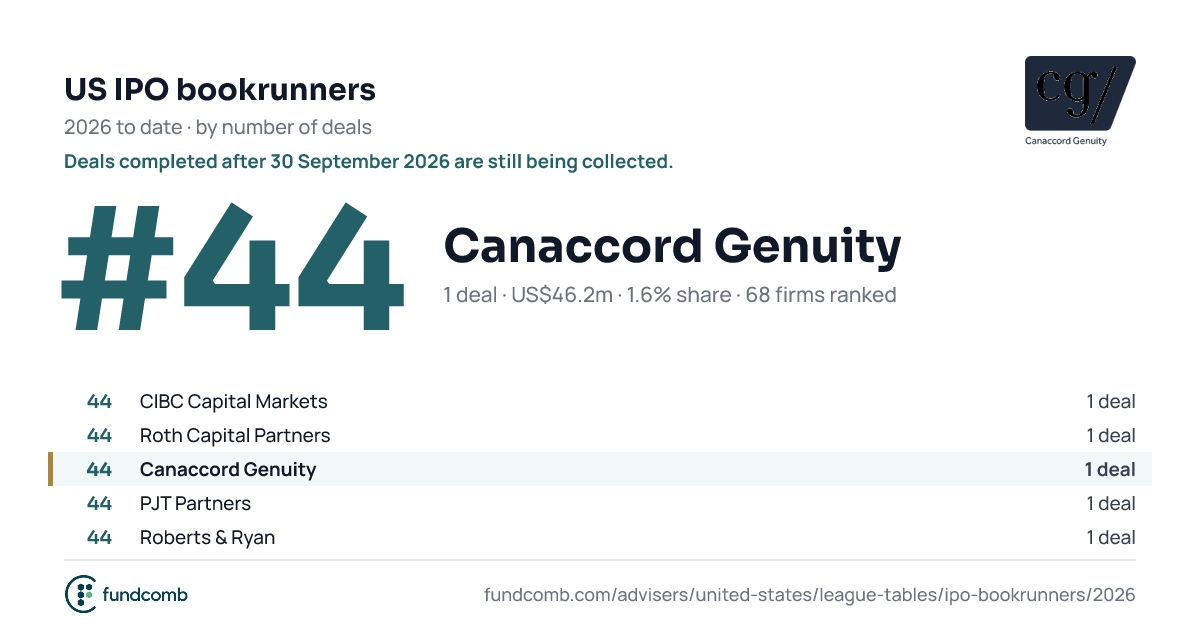
| 44 | Canaccord Genuity US$46.2m · 1.6% share · new | 46.2 | 1.6% | New | |
| |||||
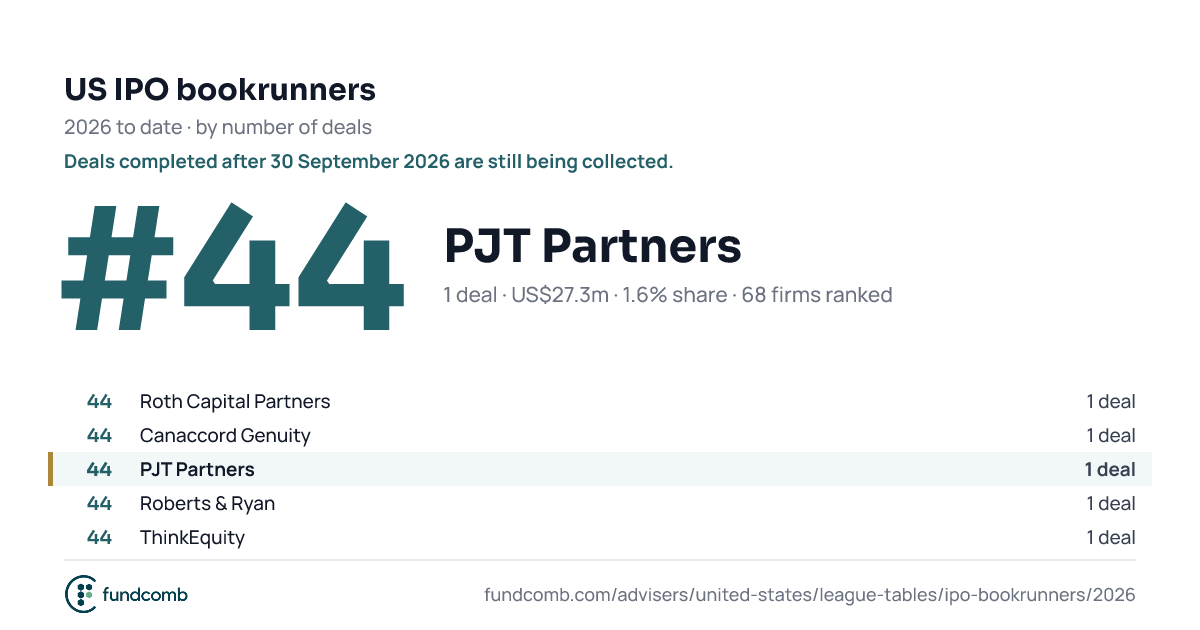
| 44 | PJT Partners US$27.3m · 1.6% share · new | 27.3 | 1.6% | New | |
| |||||
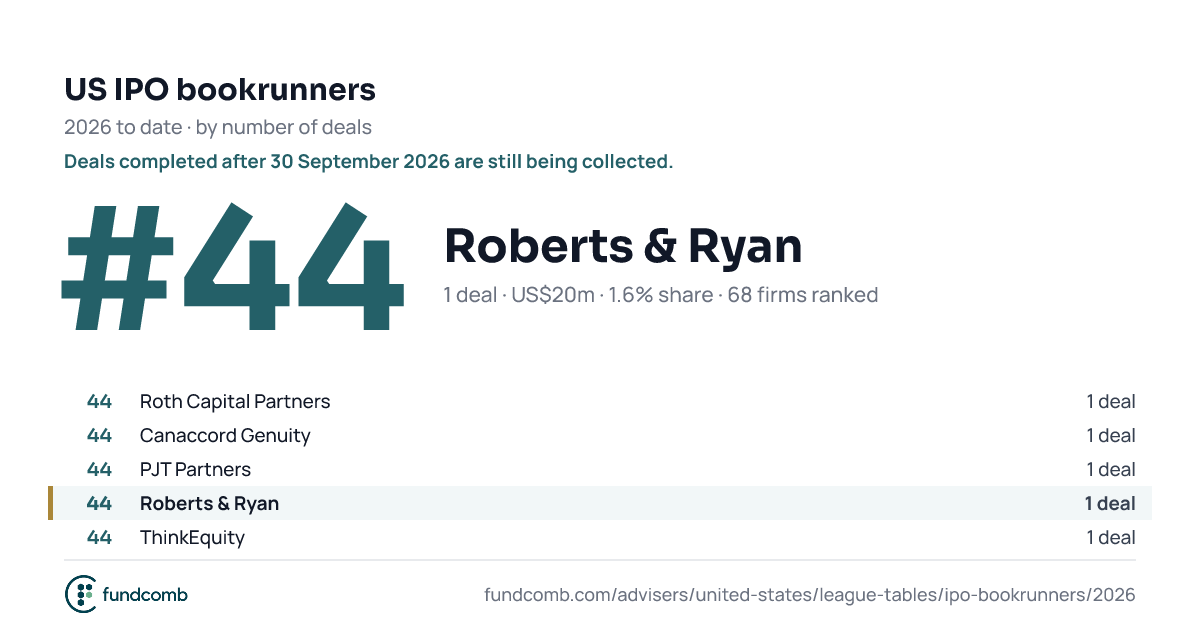
| 44 | Roberts & Ryan US$20m · 1.6% share · new | 20.0 | 1.6% | New | |
| |||||
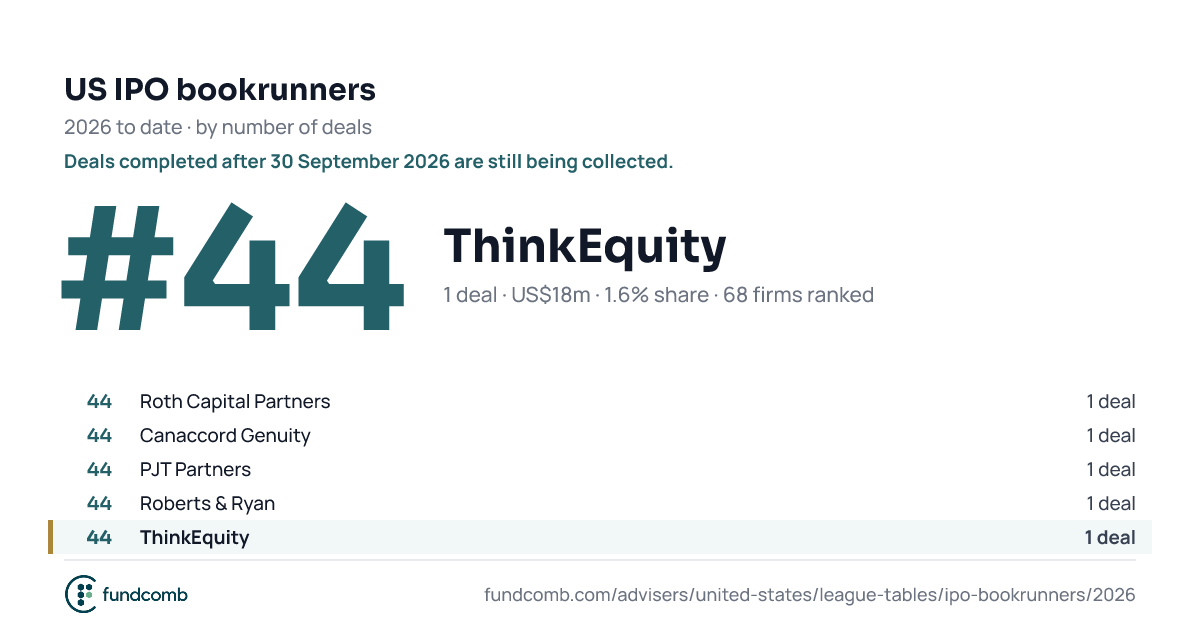
| 44 | ThinkEquity US$18m · 1.6% share · new | 18.0 | 1.6% | New | |
| |||||

Top ten by number of deals.
This table's top firms in each year.
Value is shared equally among the lead managers on each deal. 2025 YTD rank is the firm's place in the same period a year earlier, under the same filters. Methodology