
Australian IPO lead managers
H1 2026 · ASX IPOs listed · 15 deals · A$979m disclosed
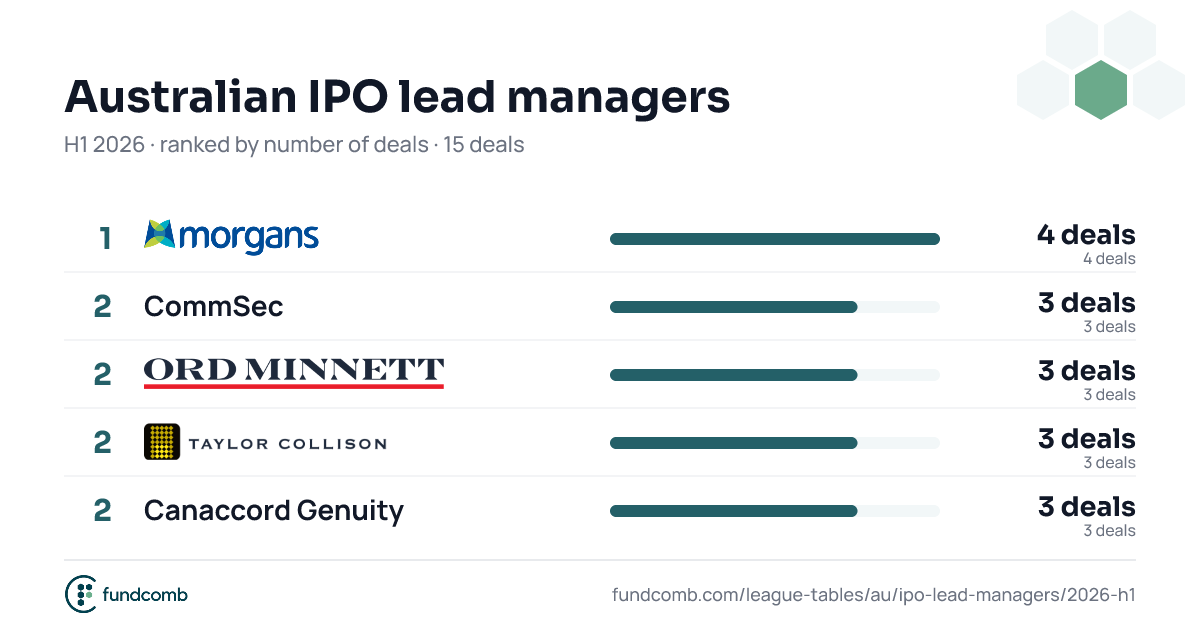
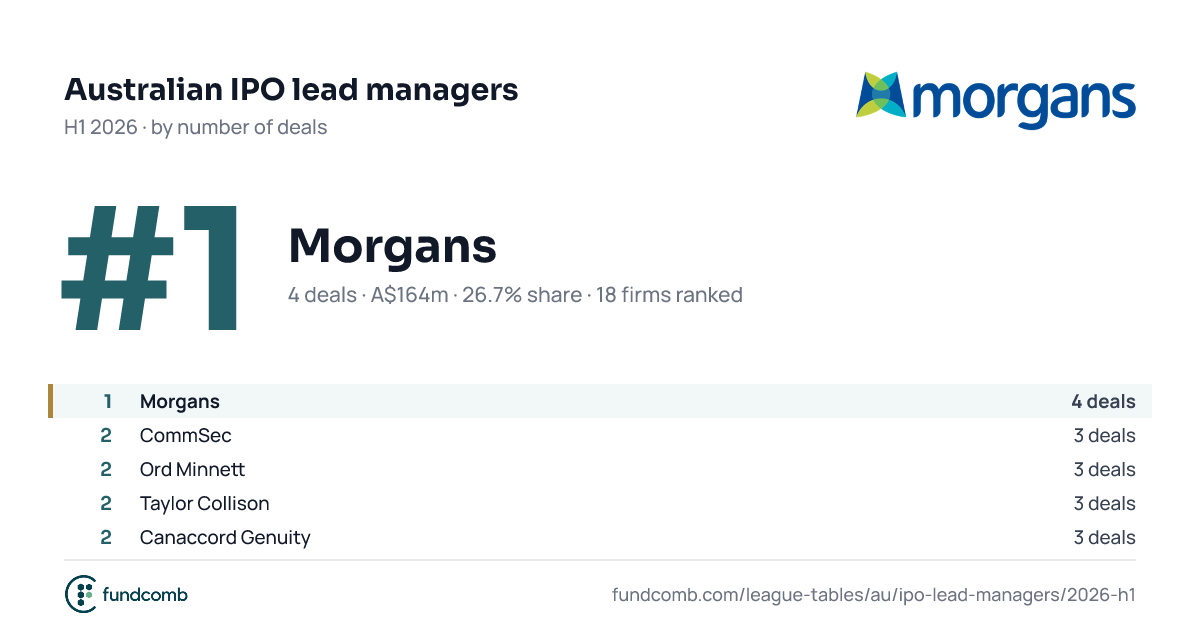
| 1 | Morgans A$164m · 26.7% share · was #1 | 163.6 | 26.7% | 1 , unchanged | |
| |||||
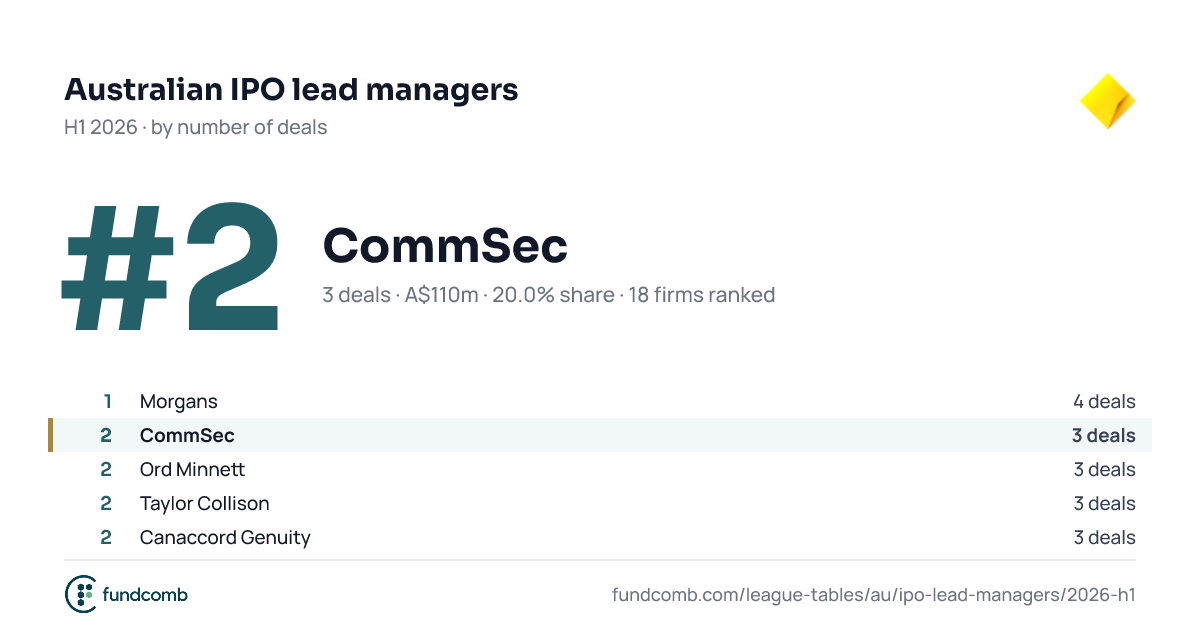
| 2 | CommSec A$110m · 20.0% share · new | 109.5 | 20.0% | New | |
| |||||
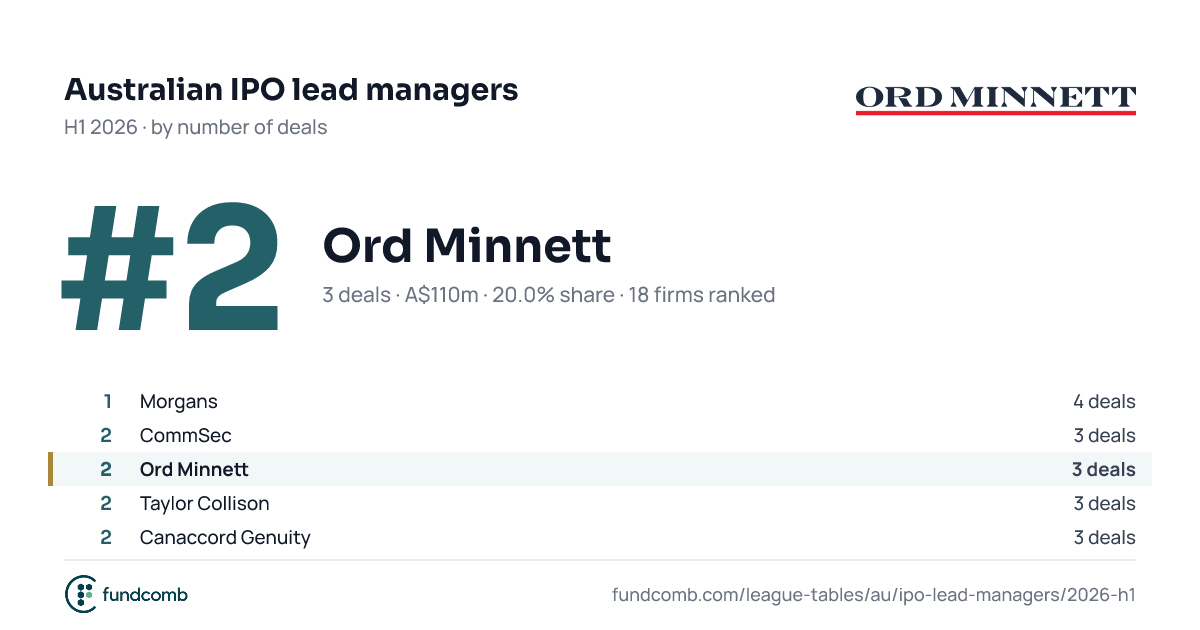
| 2 | Ord Minnett A$110m · 20.0% share · was #1 | 109.5 | 20.0% | 1 , down 1 places | |
| |||||
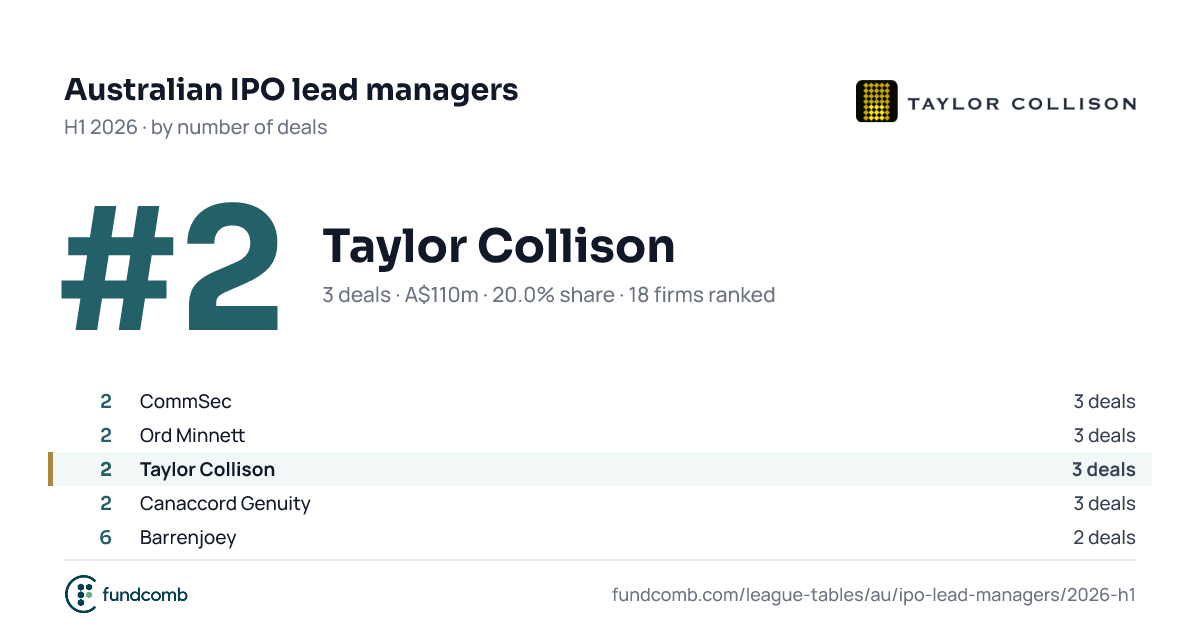
| 2 | Taylor Collison A$110m · 20.0% share · new | 109.5 | 20.0% | New | |
| |||||
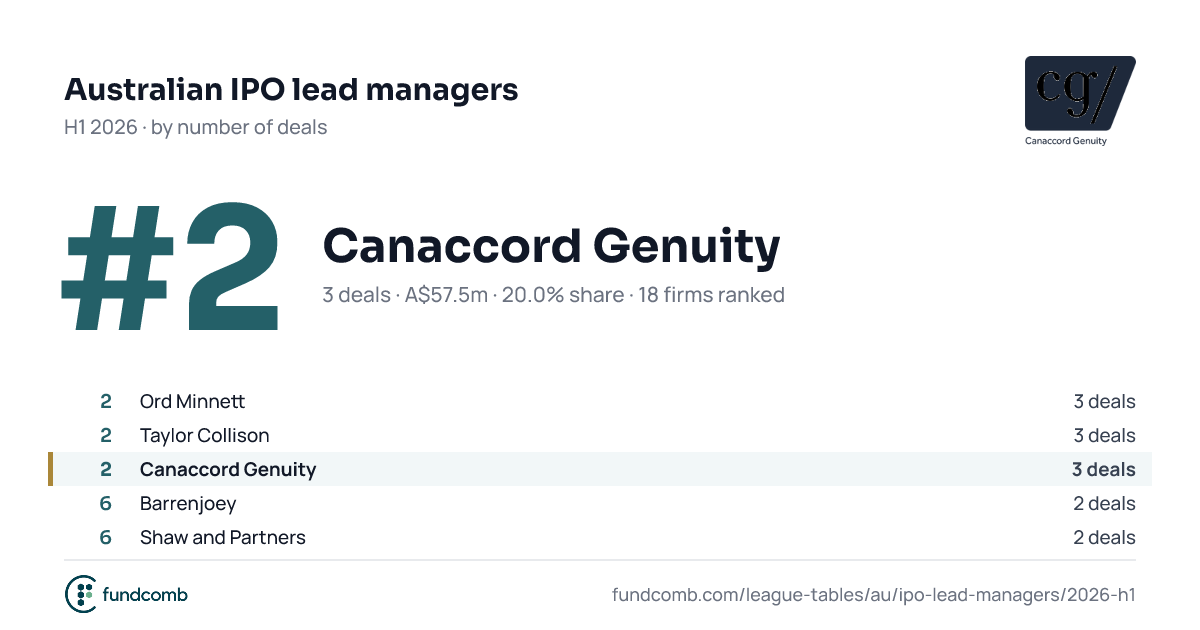
| 2 | Canaccord Genuity A$57.5m · 20.0% share · was #1 | 57.5 | 20.0% | 1 , down 1 places | |
| |||||
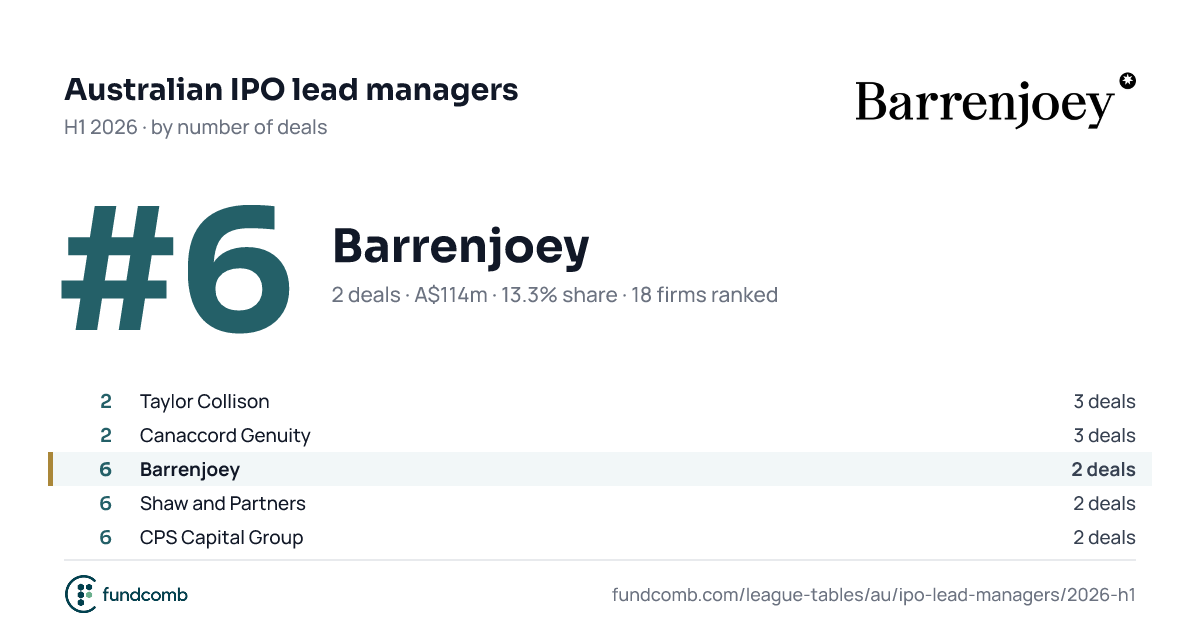
| 6 | Barrenjoey A$114m · 13.3% share · was #1 | 114.1 | 13.3% | 1 , down 5 places | |
| |||||
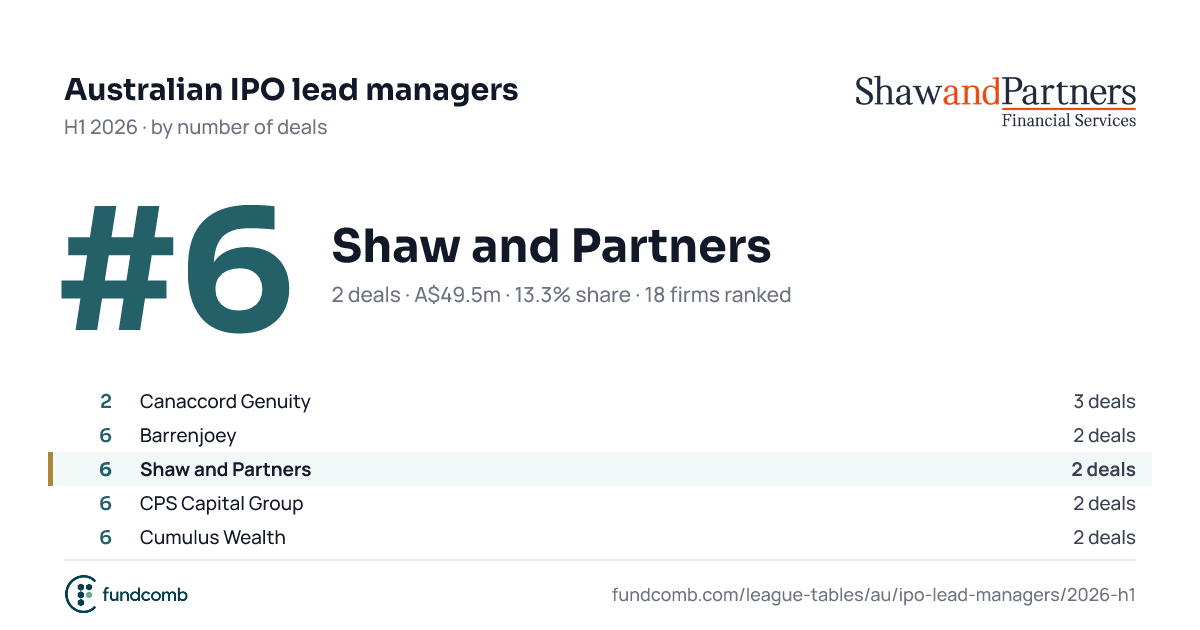
| 6 | Shaw and Partners A$49.5m · 13.3% share · was #1 | 49.5 | 13.3% | 1 , down 5 places | |
| |||||
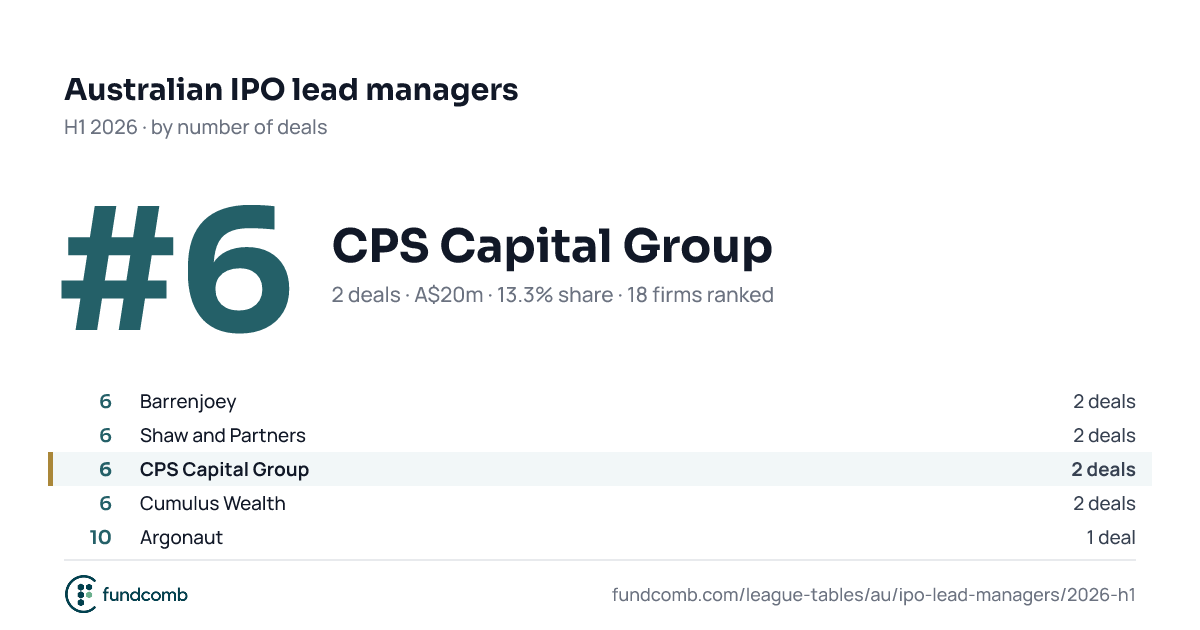
| 6 | CPS Capital Group A$20m · 13.3% share · new | 20.0 | 13.3% | New | |
| |||||
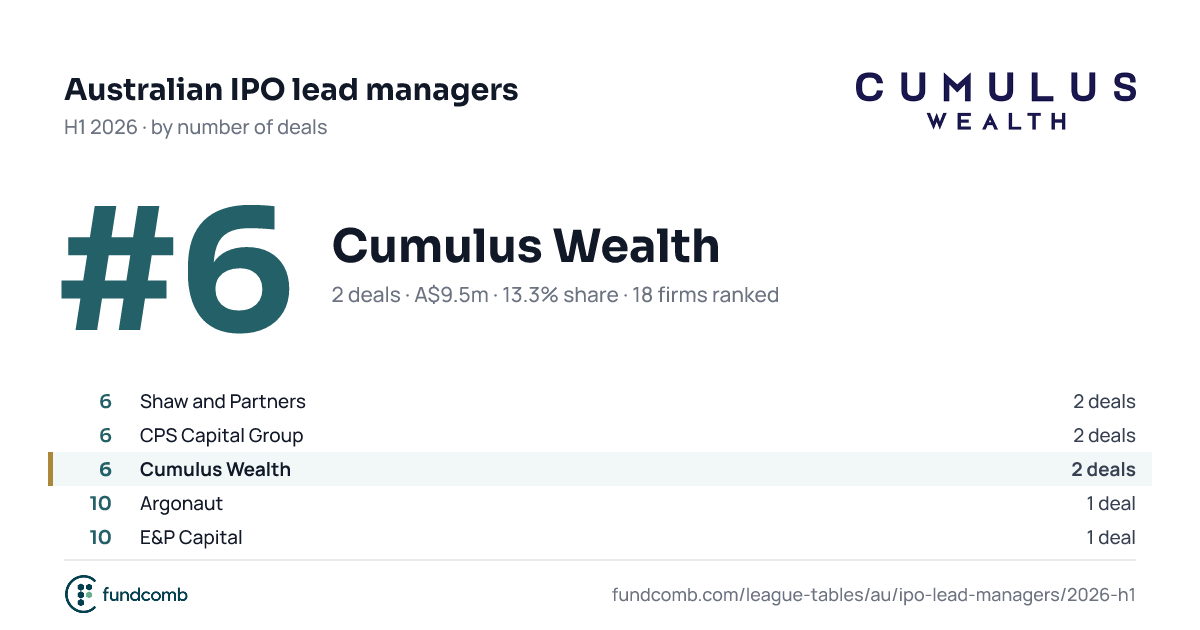
| 6 | Cumulus Wealth A$9.5m · 13.3% share · new | 9.5 | 13.3% | New | |
| |||||
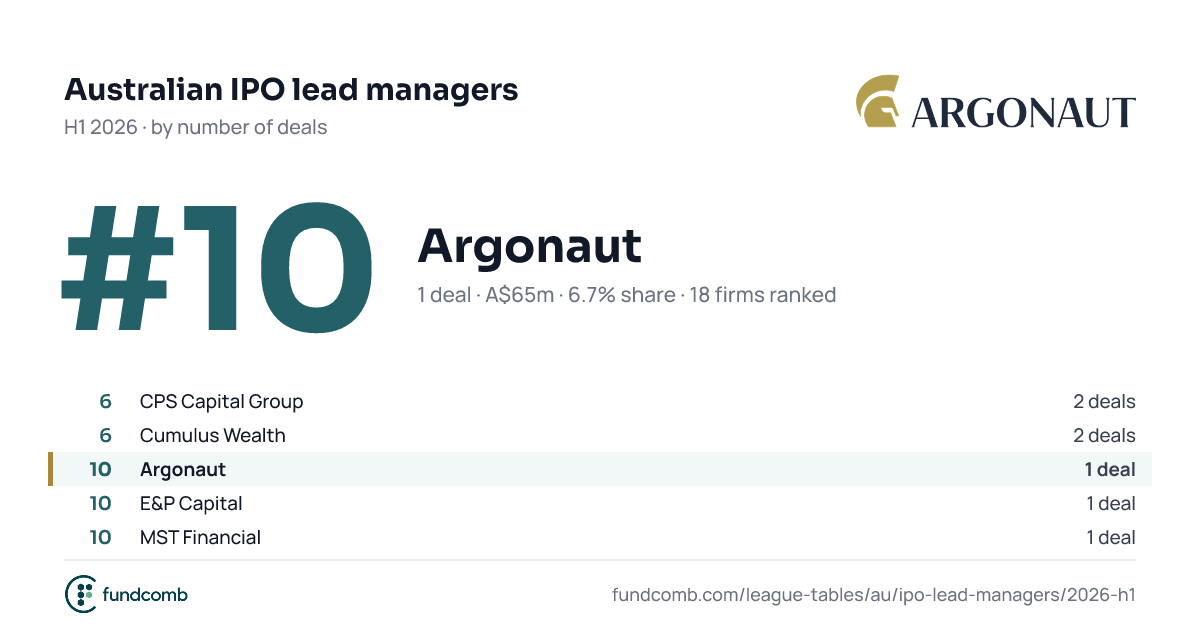
| 10 | Argonaut A$65m · 6.7% share · was #1 | 65.0 | 6.7% | 1 , down 9 places | |
| |||||
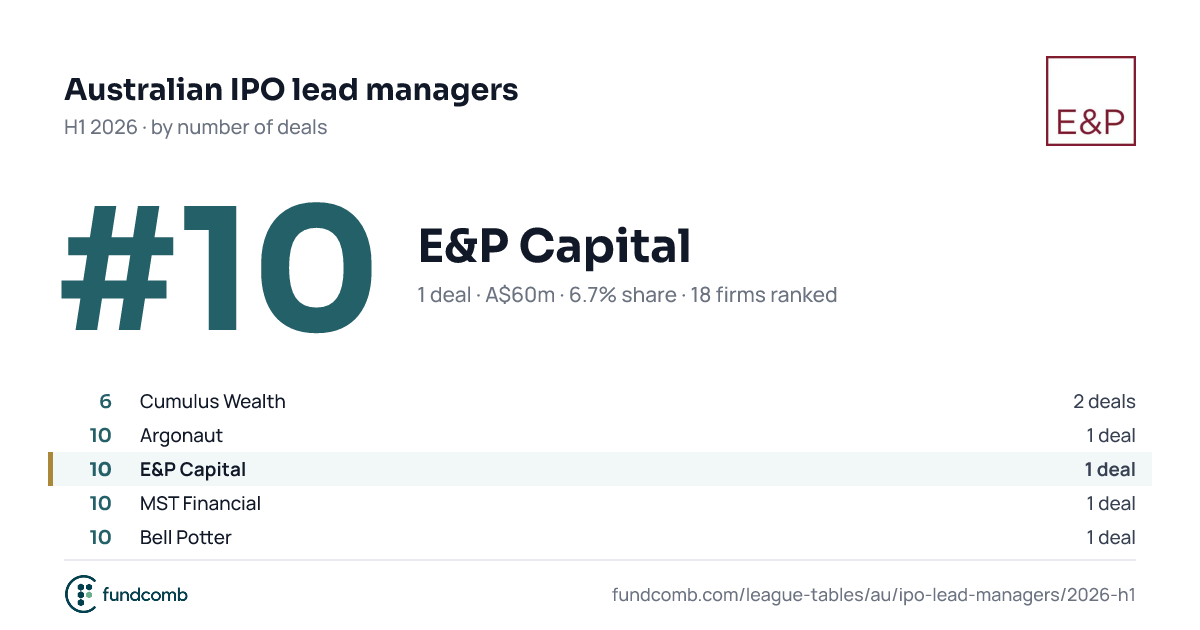
| 10 | E&P Capital A$60m · 6.7% share · new | 60.0 | 6.7% | New | |
| |||||
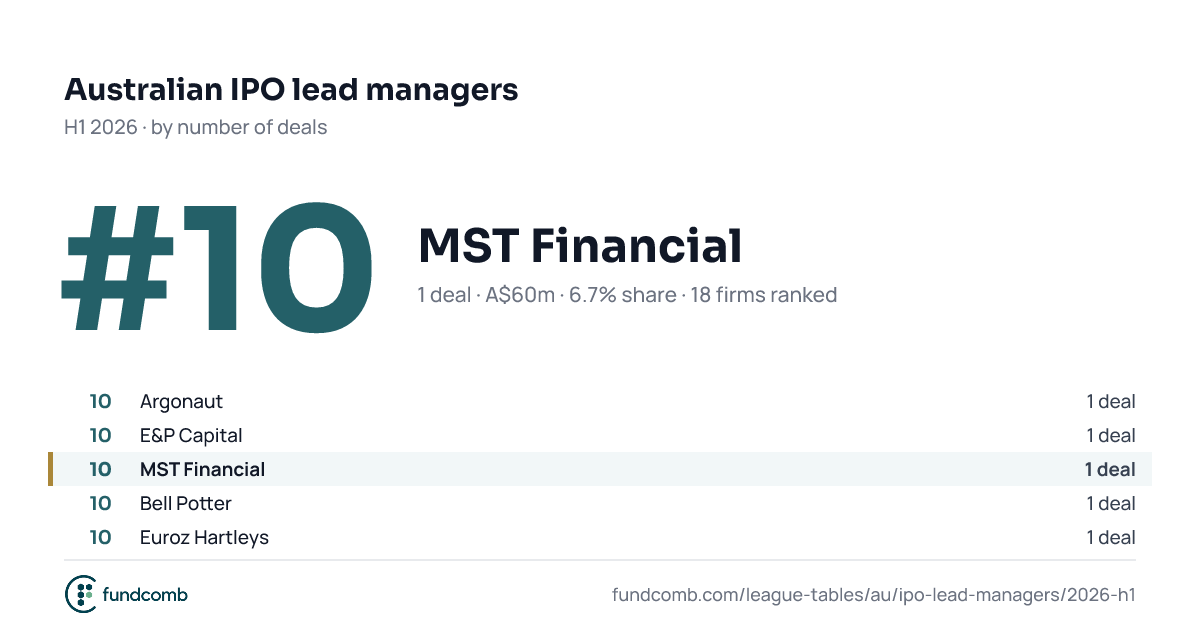
| 10 | MST Financial A$60m · 6.7% share · was #1 | 60.0 | 6.7% | 1 , down 9 places | |
| |||||
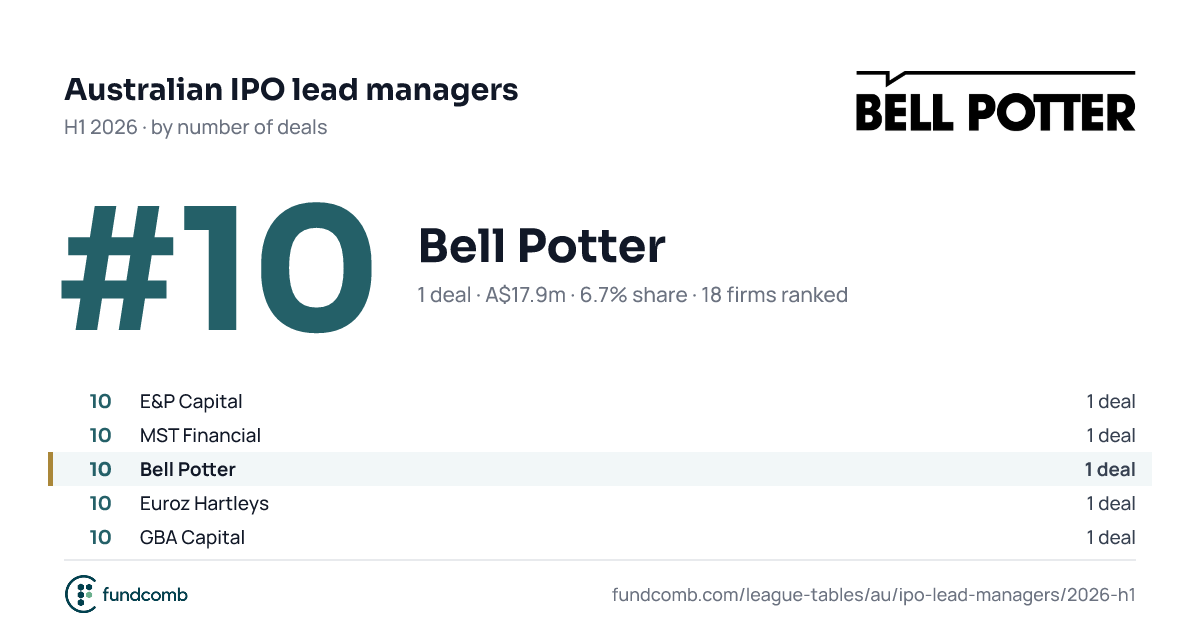
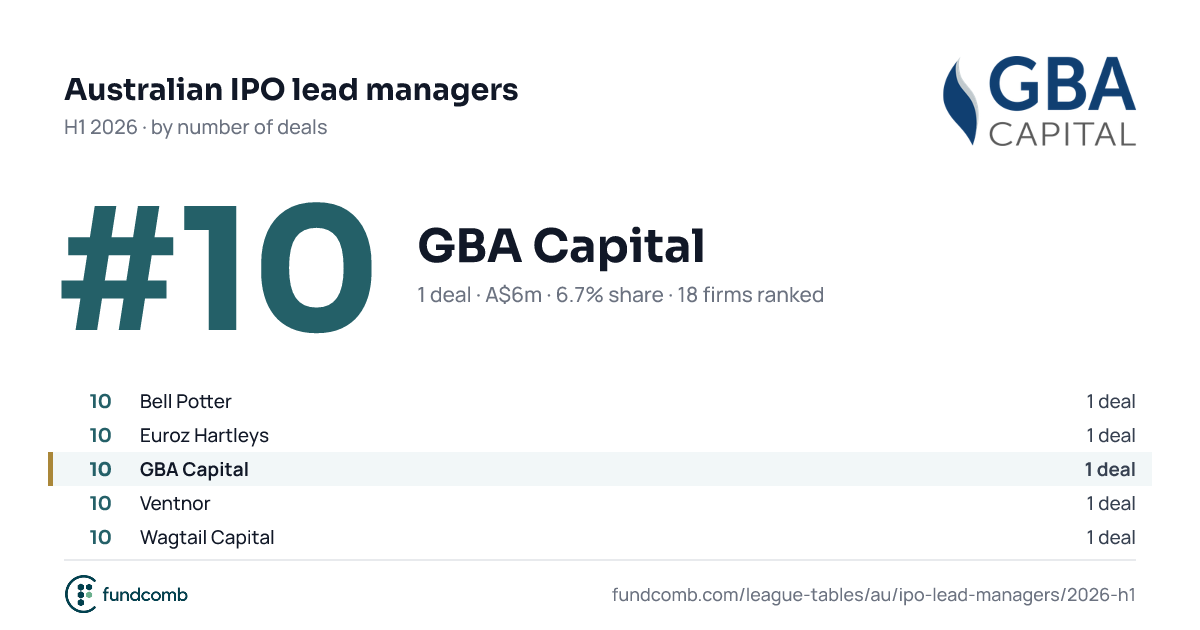
| 10 | Bell Potter A$17.9m · 6.7% share · was #1 | 17.9 | 6.7% | 1 , down 9 places | |
| |||||
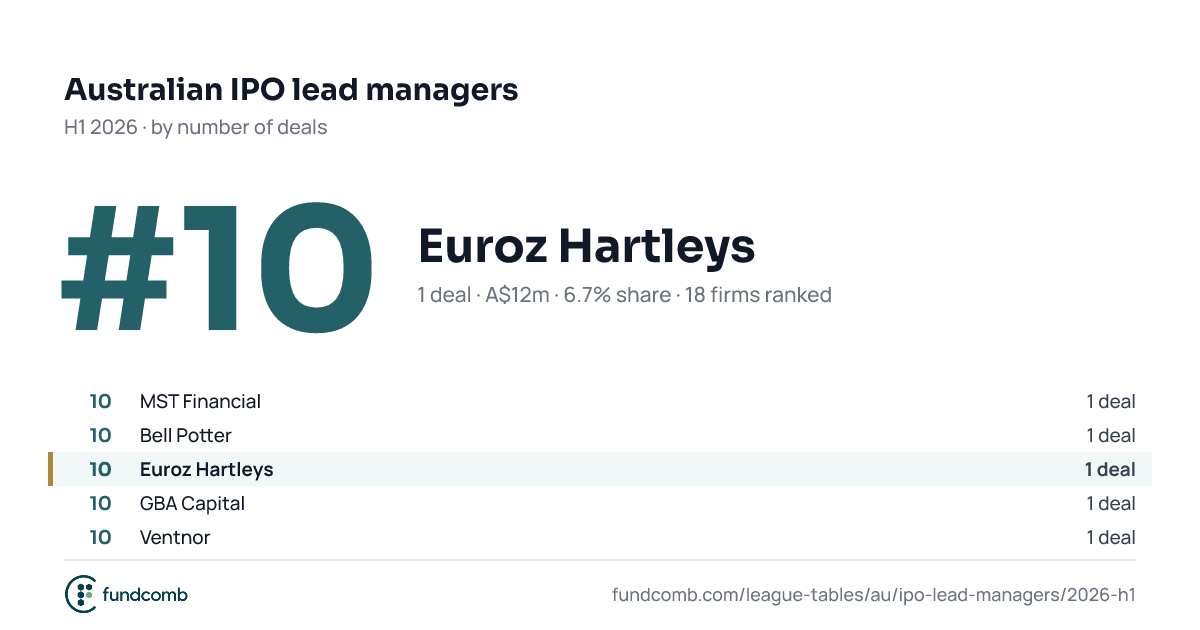
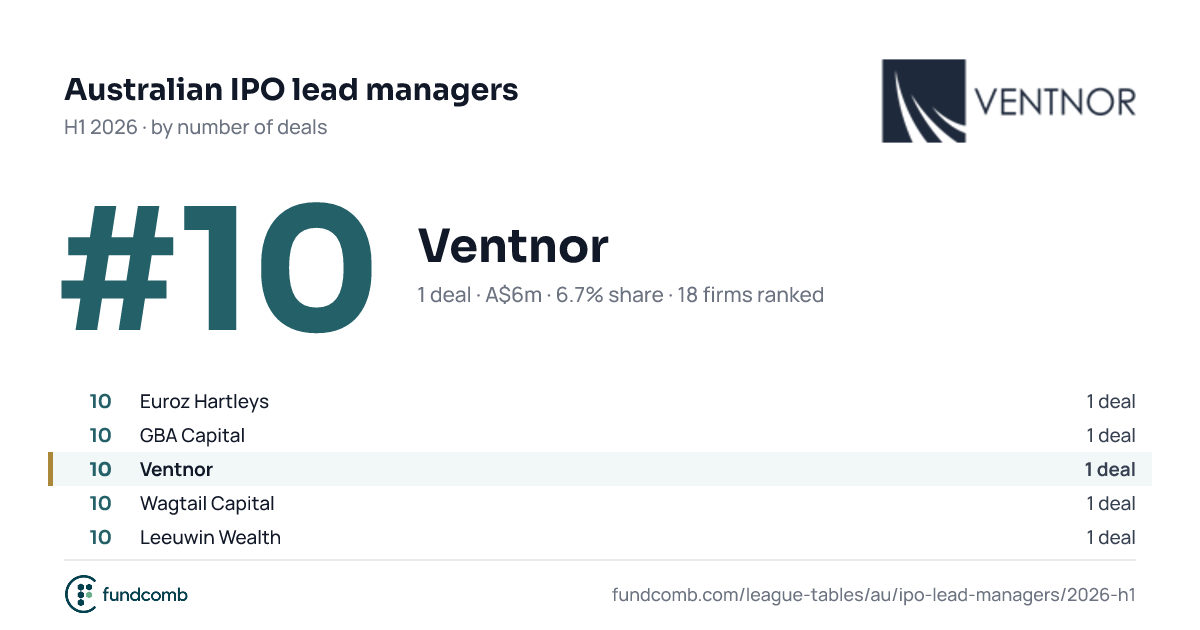
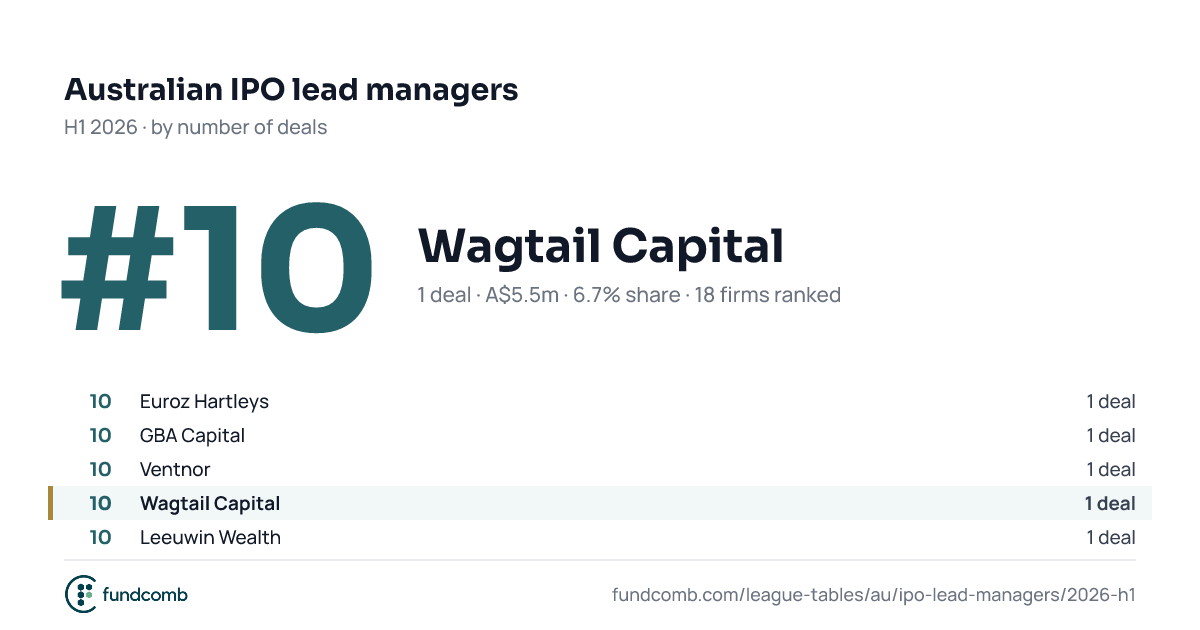
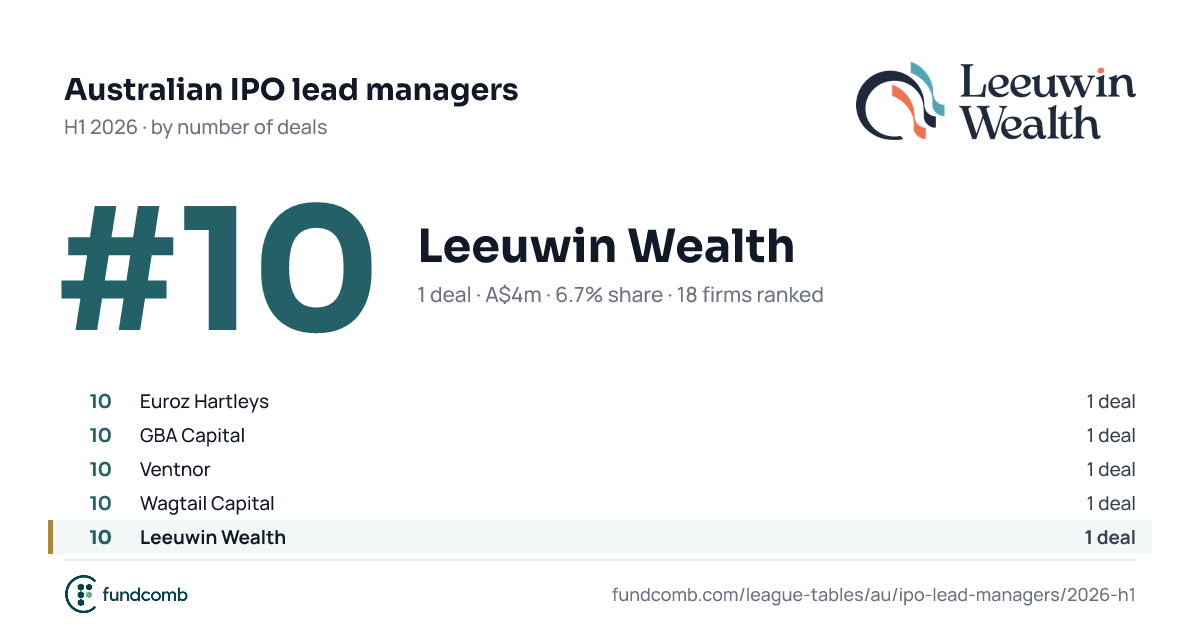
| 10 | Euroz Hartleys A$12m · 6.7% share · new | 12.0 | 6.7% | New | |
| |||||
| 10 | GBA Capital A$6m · 6.7% share · new | 6.0 | 6.7% | New | |
| |||||
| 10 | Ventnor A$6m · 6.7% share · new | 6.0 | 6.7% | New | |
| |||||
| 10 | Wagtail Capital A$5.5m · 6.7% share · new | 5.5 | 6.7% | New | |
| |||||
| 10 | Leeuwin Wealth A$4m · 6.7% share · new | 4.0 | 6.7% | New | |
| |||||
Top ten by number of deals.
This table's top firms in each year.
Value is shared equally among the lead managers on each deal. H1 2025 rank is the firm's place in the same period a year earlier, under the same filters. Methodology