
US IPO bookrunners
Q3 2026 · US-listed IPOs · 20 deals · US$5.4bn disclosed
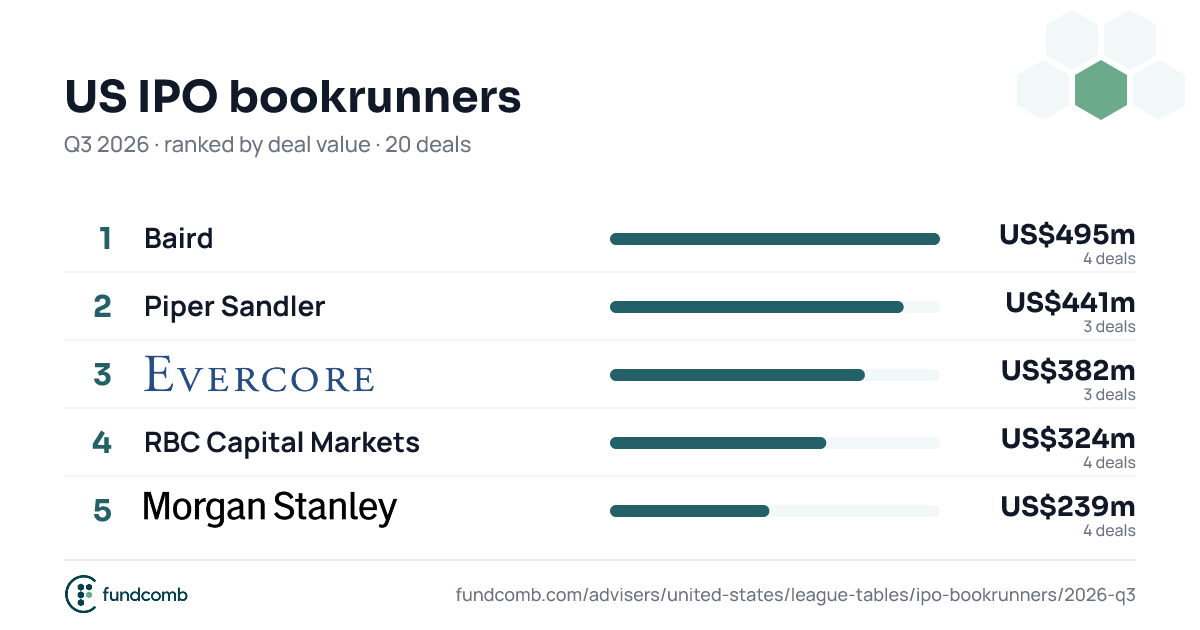
| 1 | Baird 4 deals · 9.1% share · new | 495.1 | 9.1% | New | |
| |||||
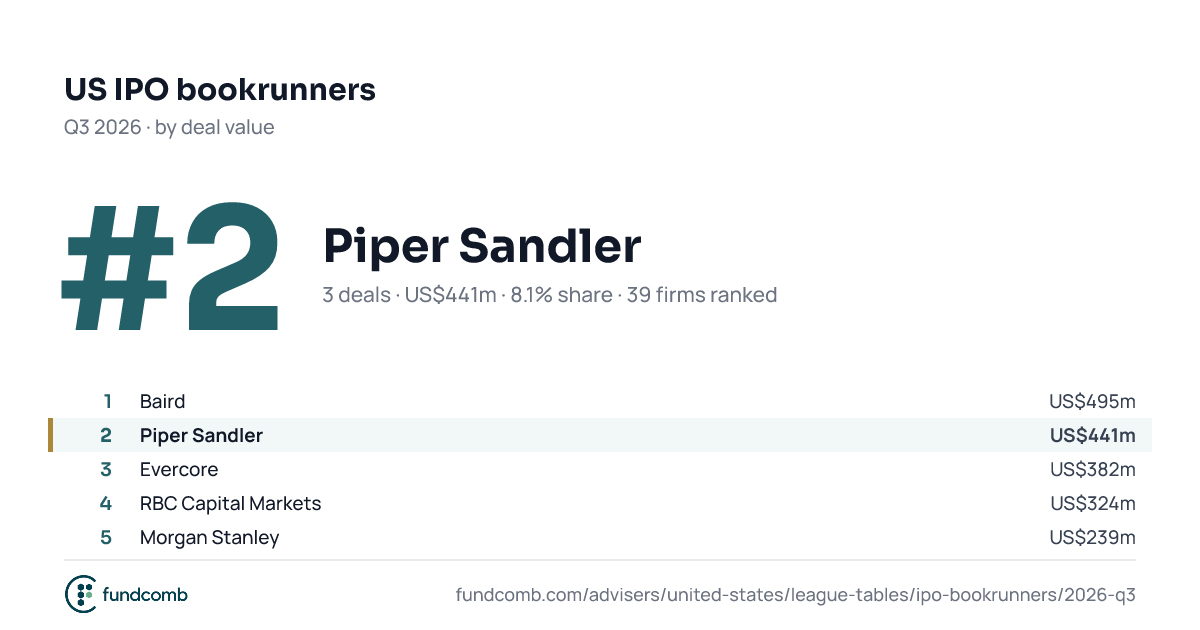
| 2 | Piper Sandler 3 deals · 8.1% share · new | 440.7 | 8.1% | New | |
| |||||
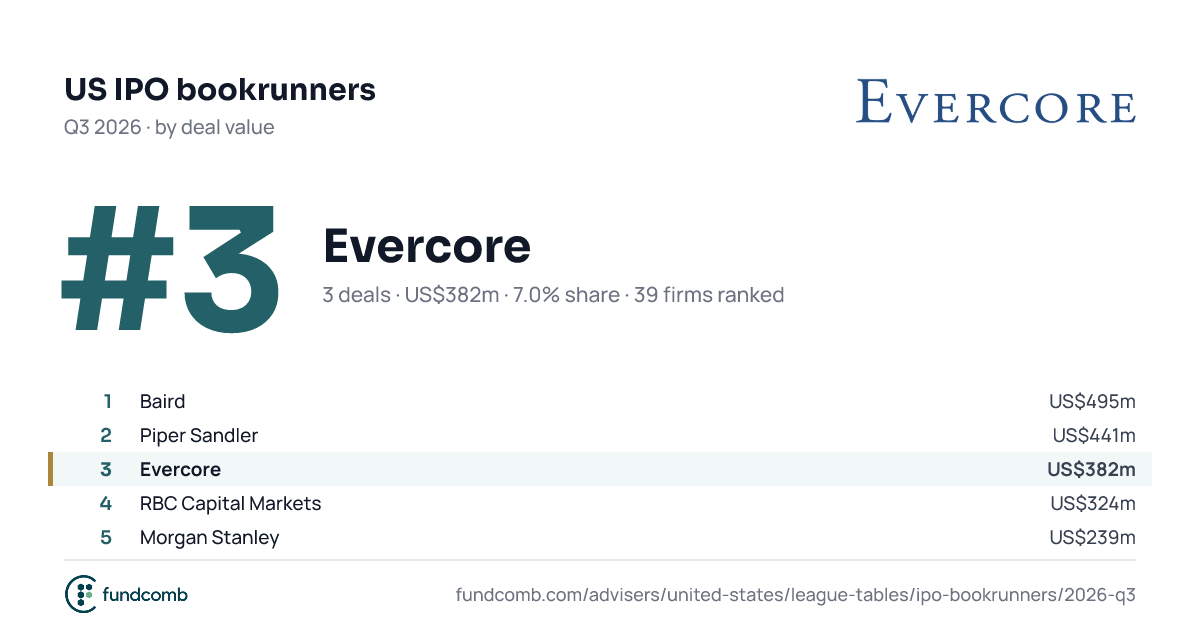
| 3 | Evercore 3 deals · 7.0% share · new | 382.4 | 7.0% | New | |
| |||||
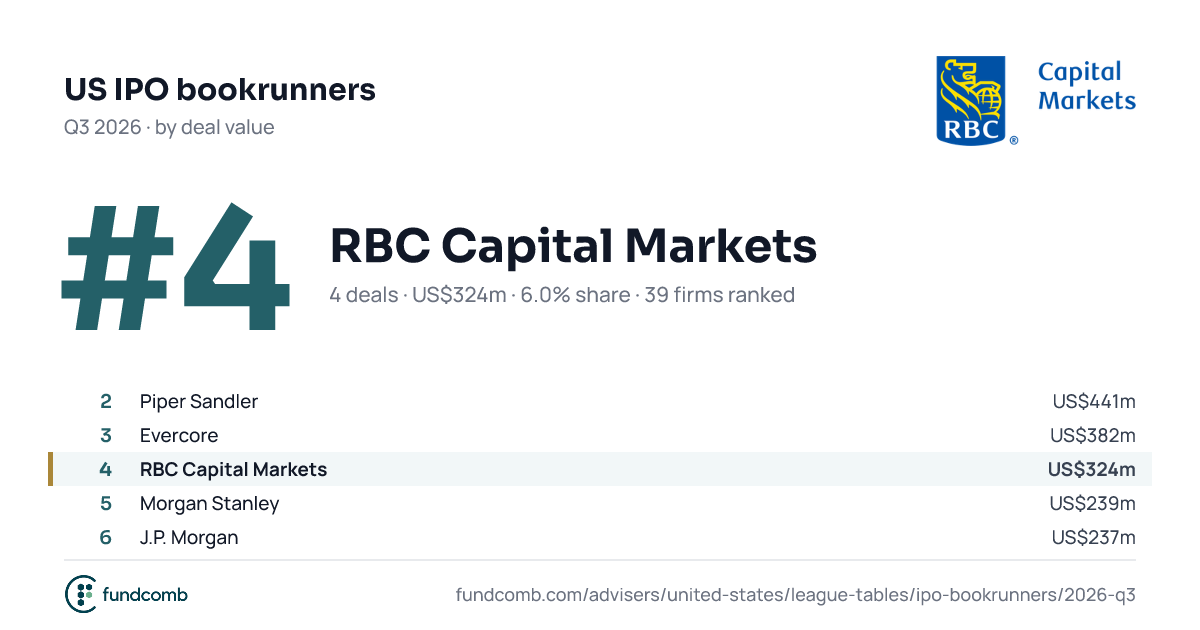
| 4 | RBC Capital Markets 4 deals · 6.0% share · new | 324.5 | 6.0% | New | |
| |||||
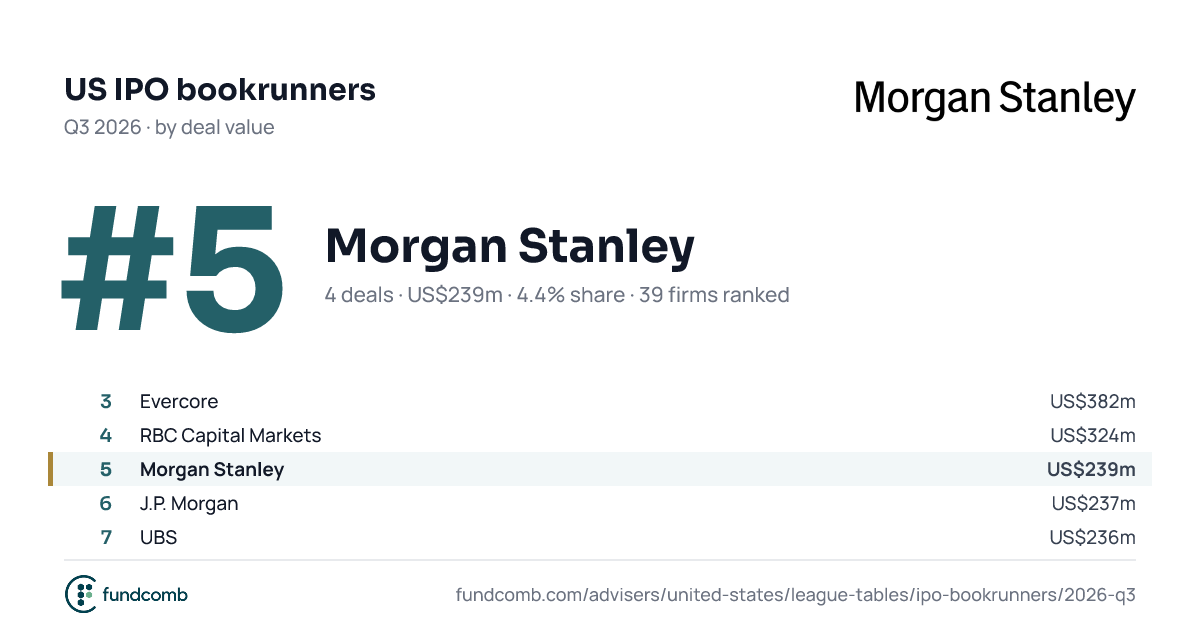
| 5 | Morgan Stanley 4 deals · 4.4% share · new | 239.2 | 4.4% | New | |
| |||||
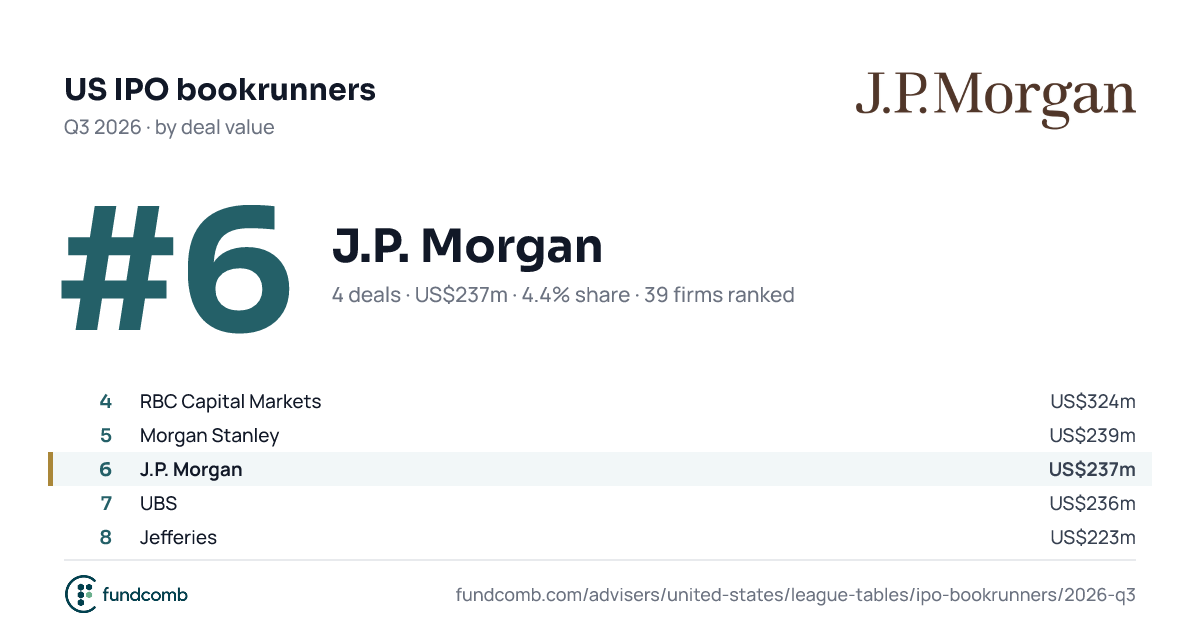
| 6 | J.P. Morgan 4 deals · 4.4% share · new | 236.7 | 4.4% | New | |
| |||||
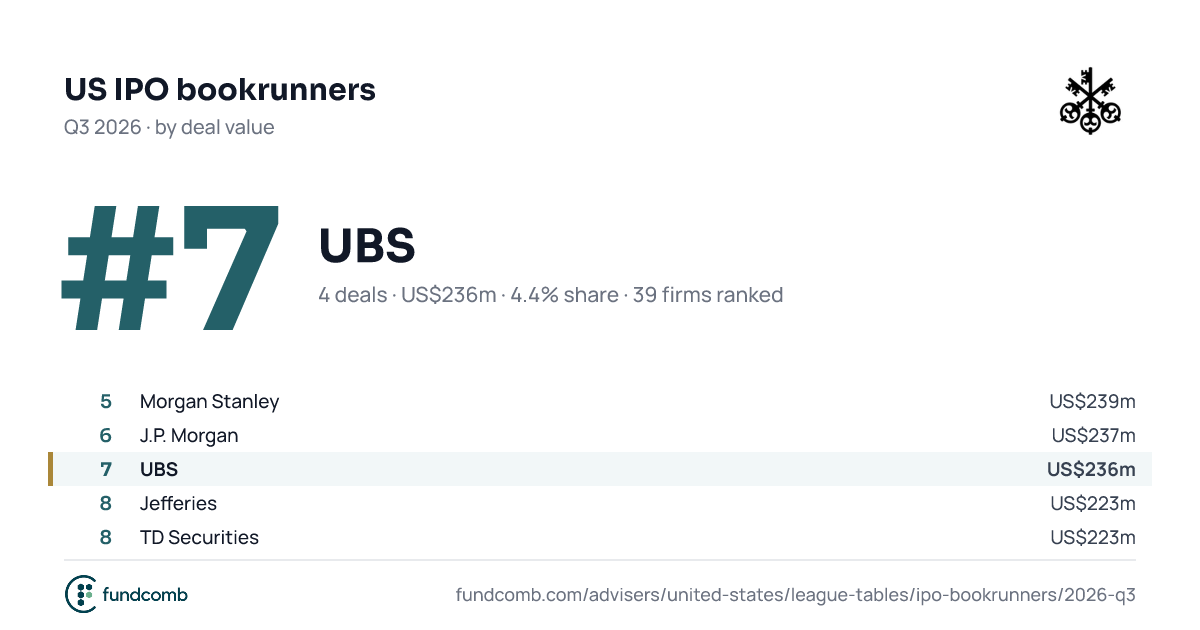
| 7 | UBS 4 deals · 4.4% share · new | 236.4 | 4.4% | New | |
| |||||
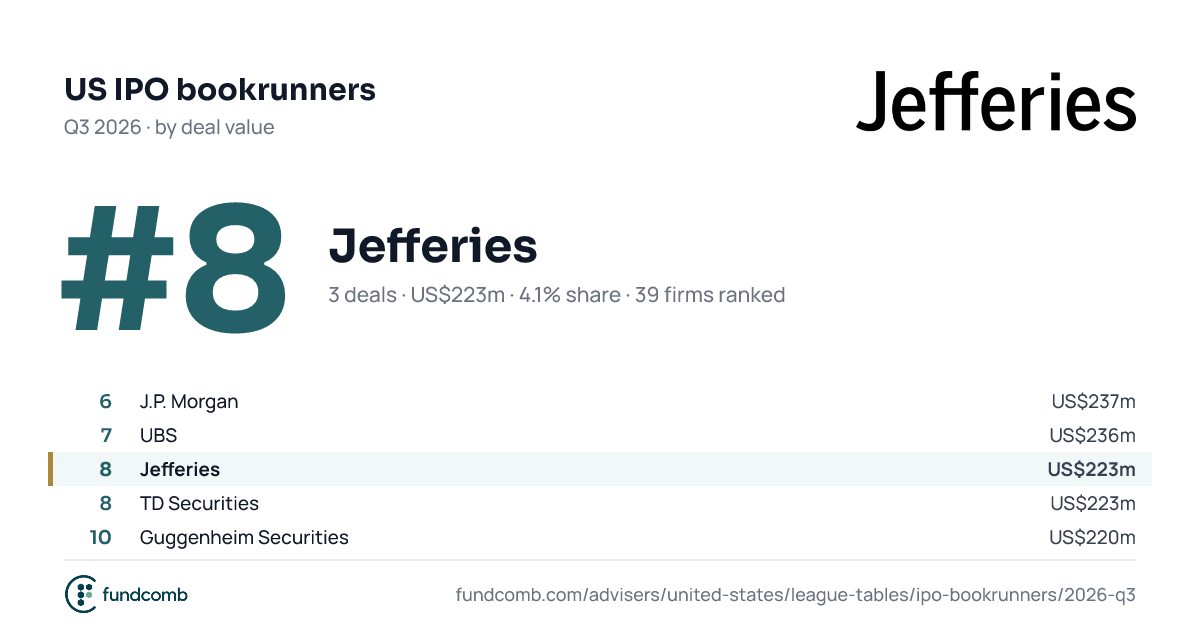
| 8 | Jefferies 3 deals · 4.1% share · new | 223.2 | 4.1% | New | |
| |||||
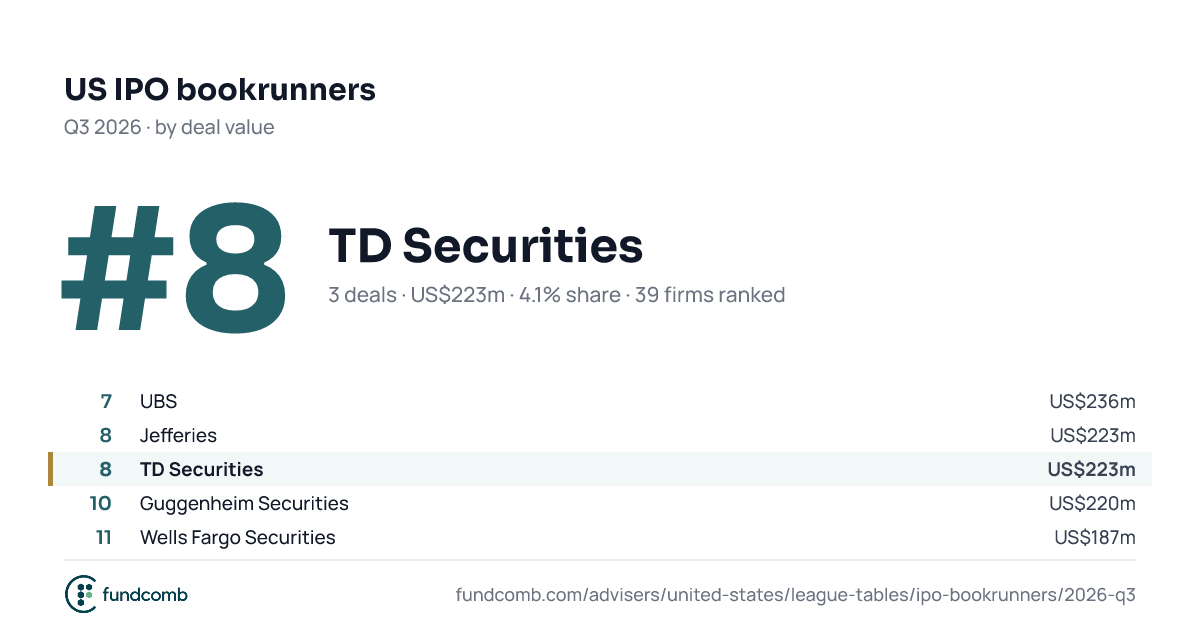
| 8 | TD Securities 3 deals · 4.1% share · new | 223.2 | 4.1% | New | |
| |||||
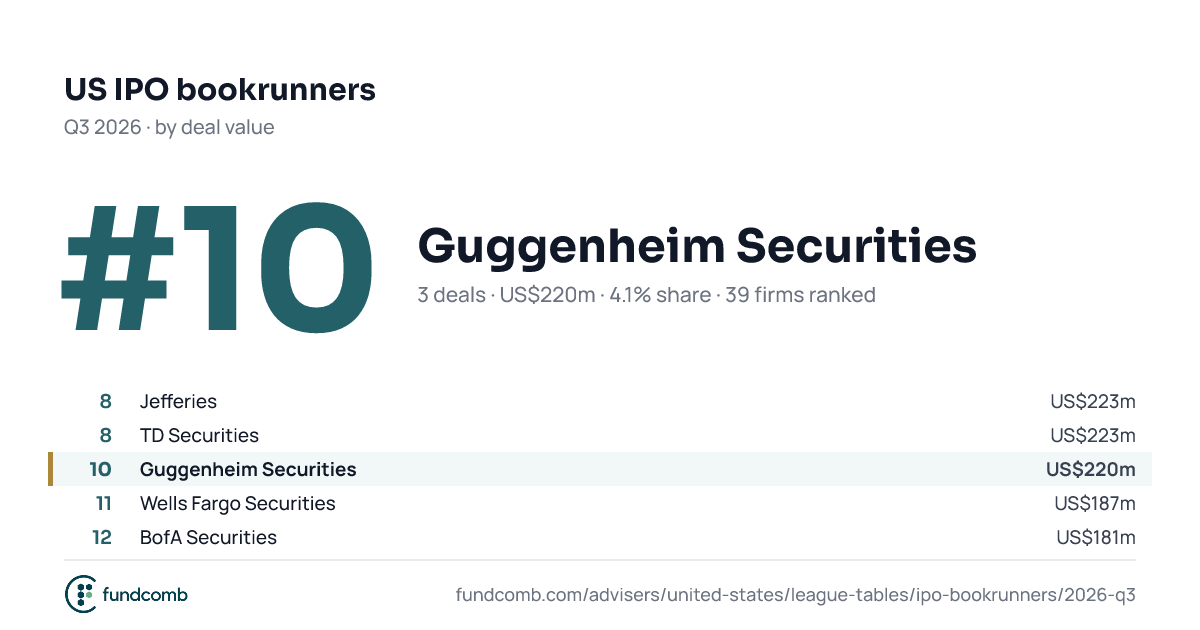
| 10 | Guggenheim Securities 3 deals · 4.1% share · new | 220.4 | 4.1% | New | |
| |||||
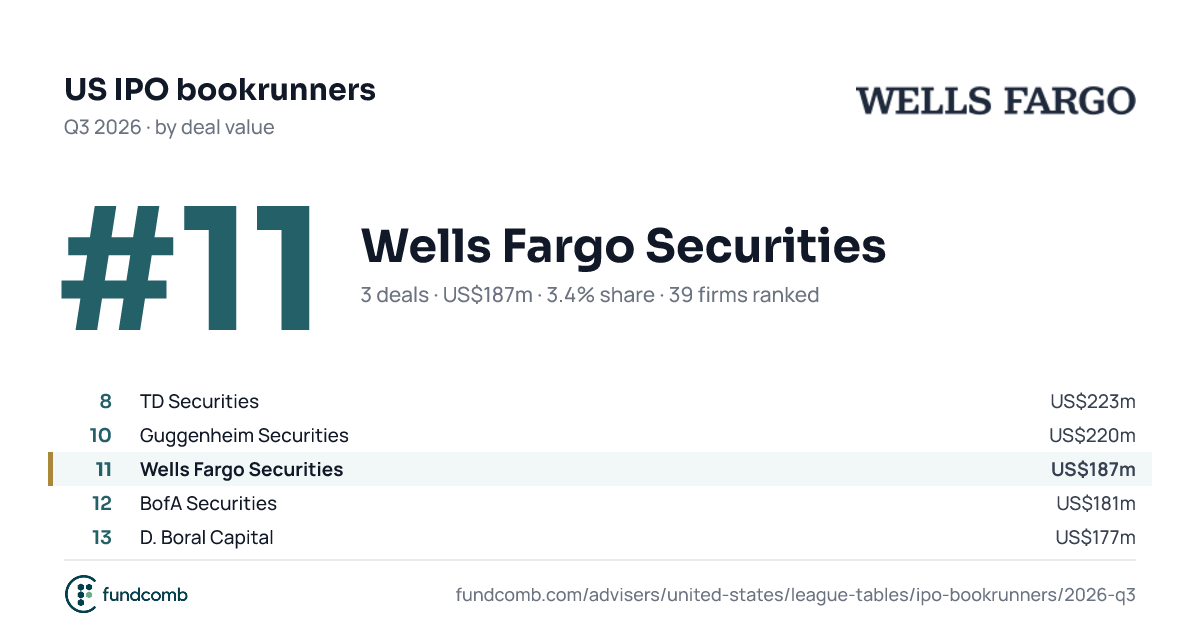
| 11 | Wells Fargo Securities 3 deals · 3.4% share · new | 186.7 | 3.4% | New | |
| |||||
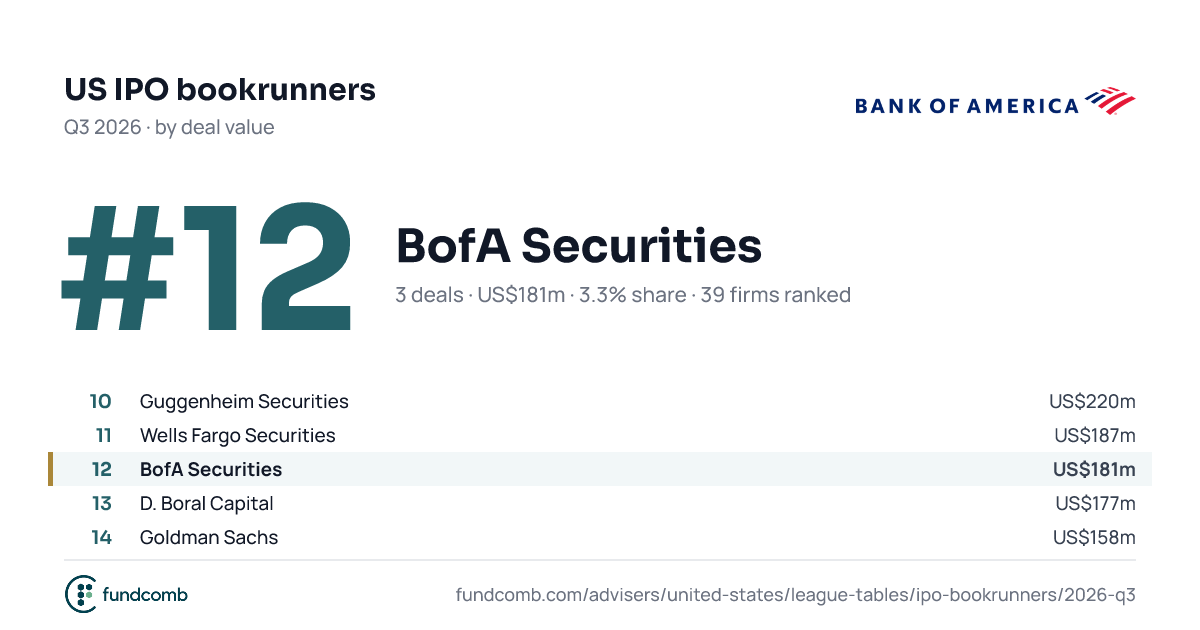
| 12 | BofA Securities 3 deals · 3.3% share · new | 181.4 | 3.3% | New | |
| |||||
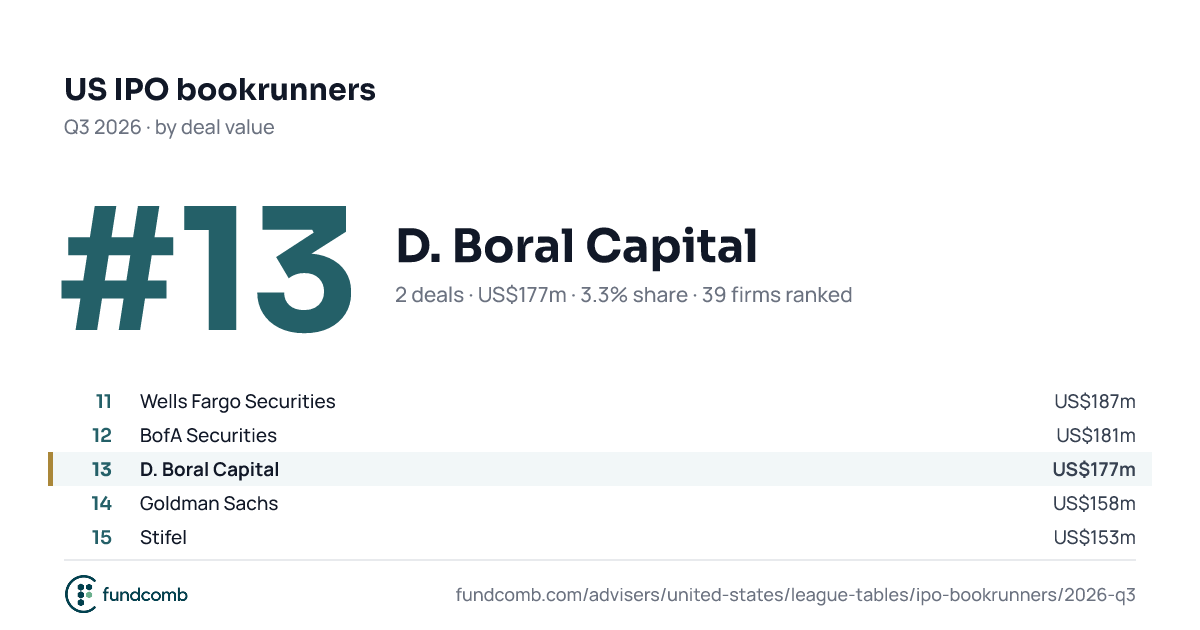
| 13 | D. Boral Capital 2 deals · 3.3% share · new | 176.5 | 3.3% | New | |
| |||||
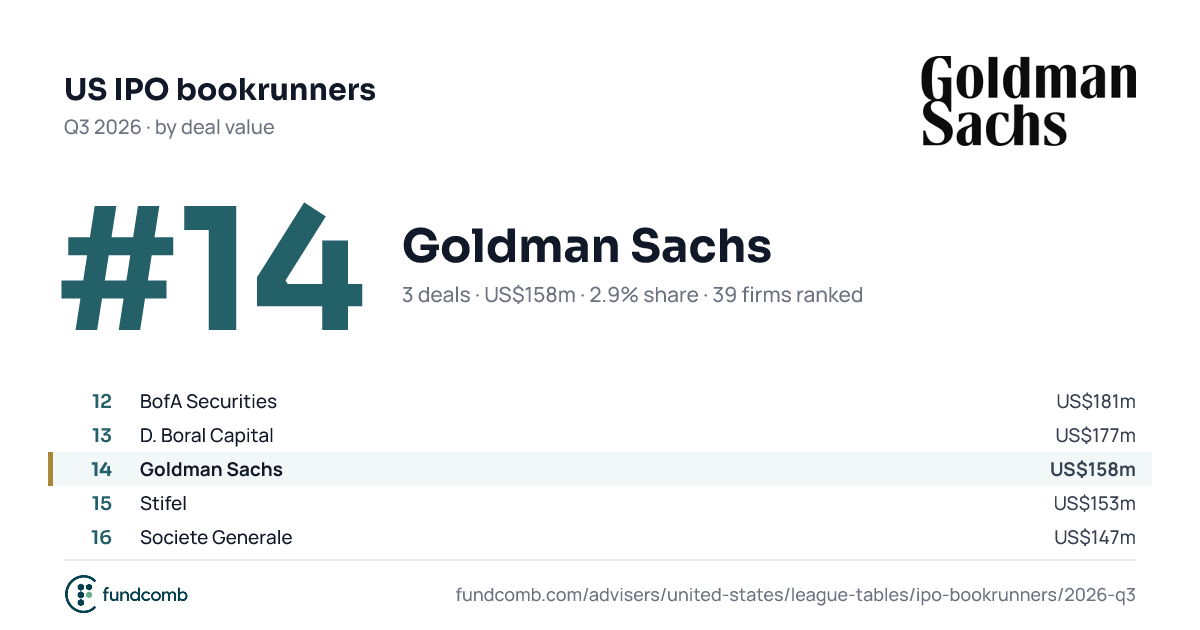
| 14 | Goldman Sachs 3 deals · 2.9% share · new | 158.2 | 2.9% | New | |
| |||||
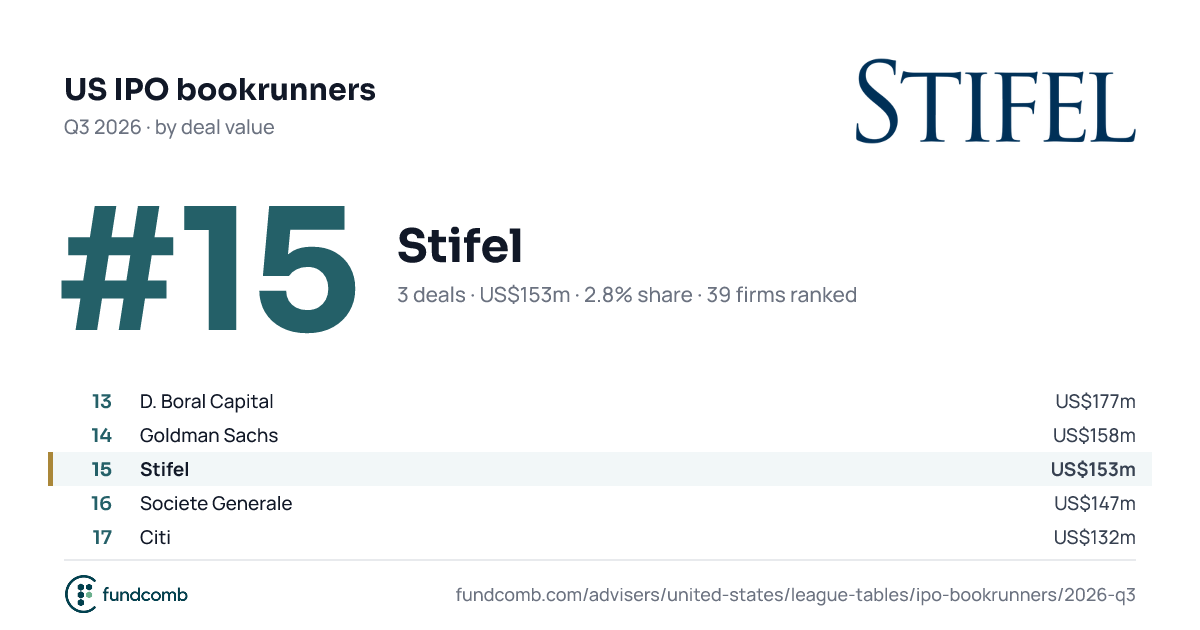
| 15 | Stifel 3 deals · 2.8% share · new | 152.9 | 2.8% | New | |
| |||||
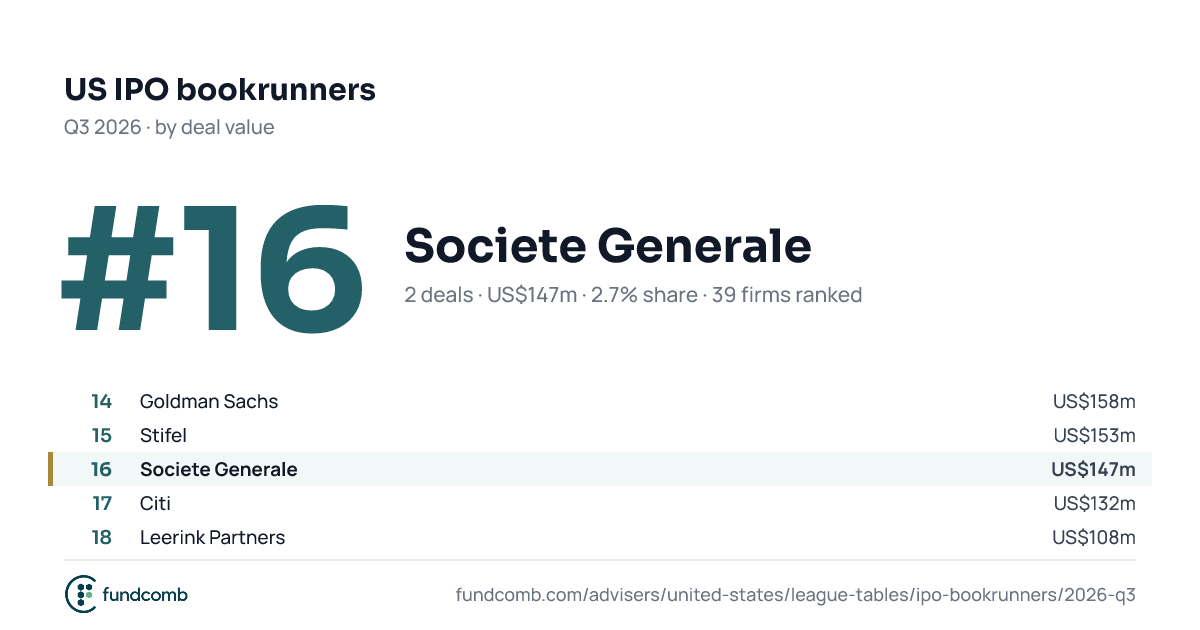
| 16 | Societe Generale 2 deals · 2.7% share · new | 146.7 | 2.7% | New | |
| |||||
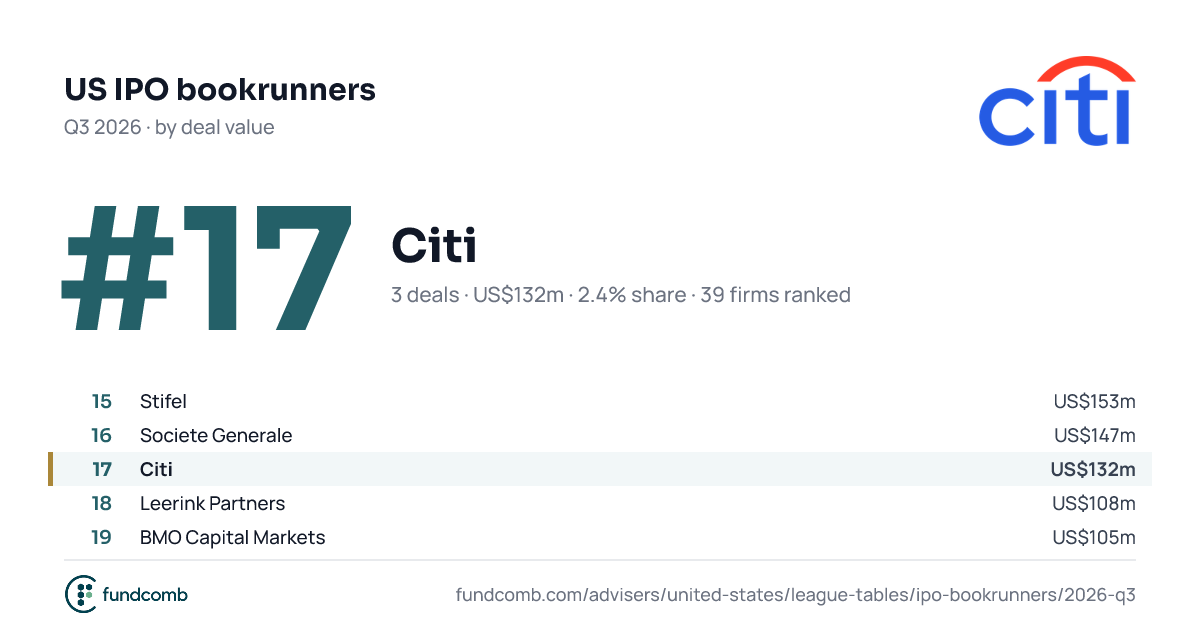
| 17 | Citi 3 deals · 2.4% share · new | 132.5 | 2.4% | New | |
| |||||
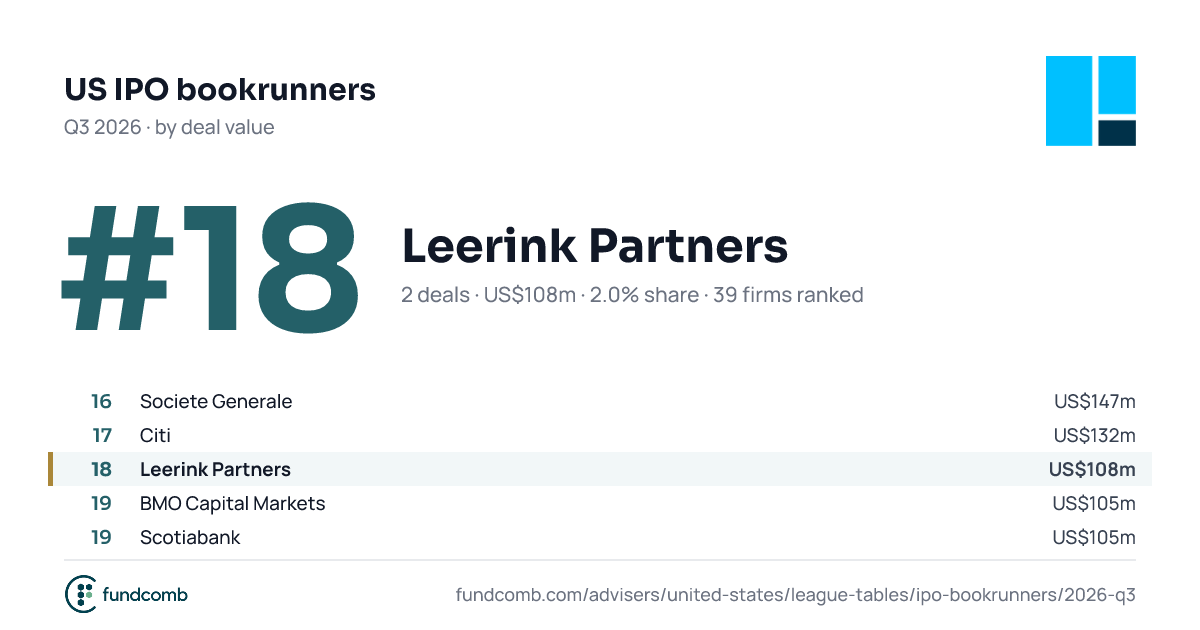
| 18 | Leerink Partners 2 deals · 2.0% share · new | 107.8 | 2.0% | New | |
| |||||
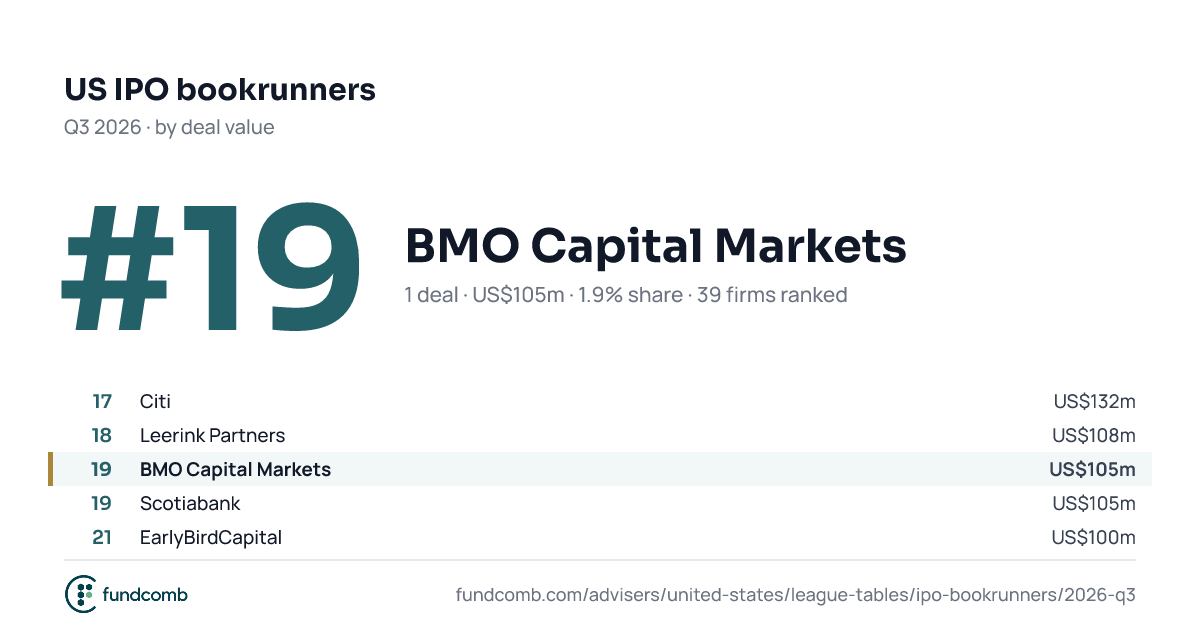
| 19 | BMO Capital Markets 1 deal · 1.9% share · new | 105.0 | 1.9% | New | |
| |||||
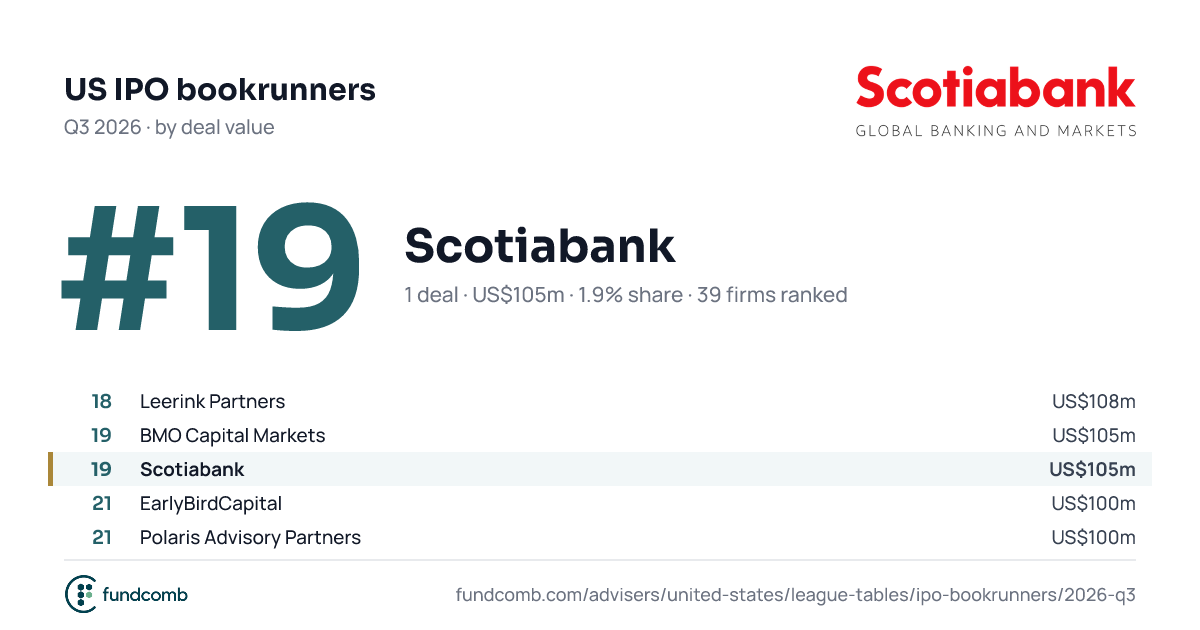
| 19 | Scotiabank 1 deal · 1.9% share · new | 105.0 | 1.9% | New | |
| |||||
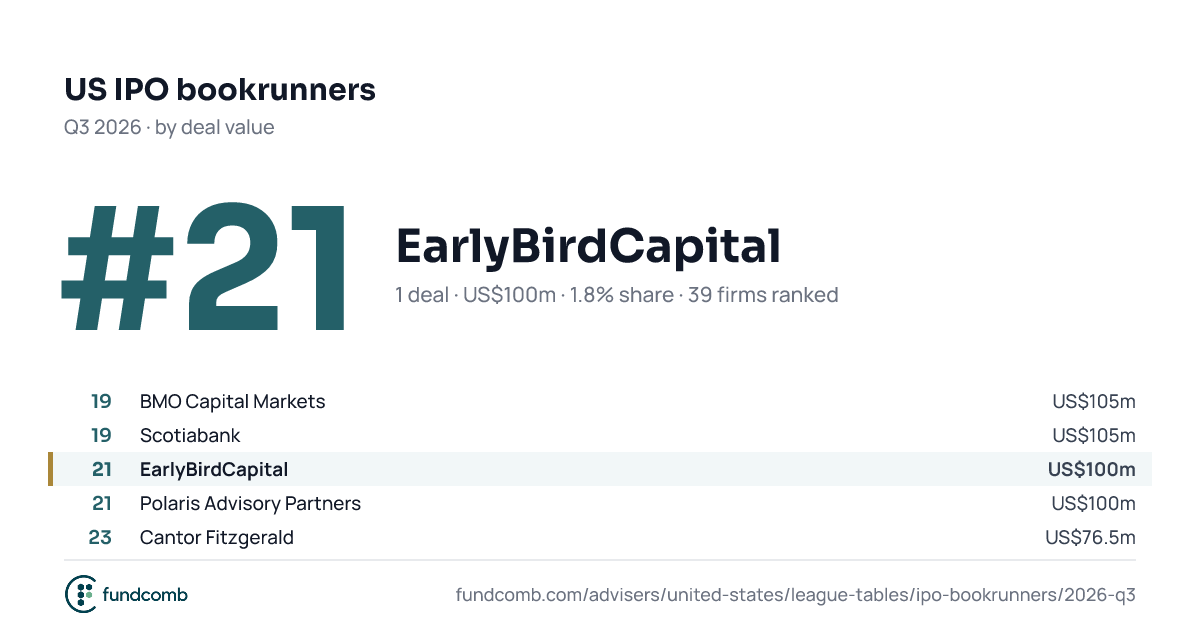
| 21 | EarlyBirdCapital 1 deal · 1.8% share · new | 100.0 | 1.8% | New | |
| |||||
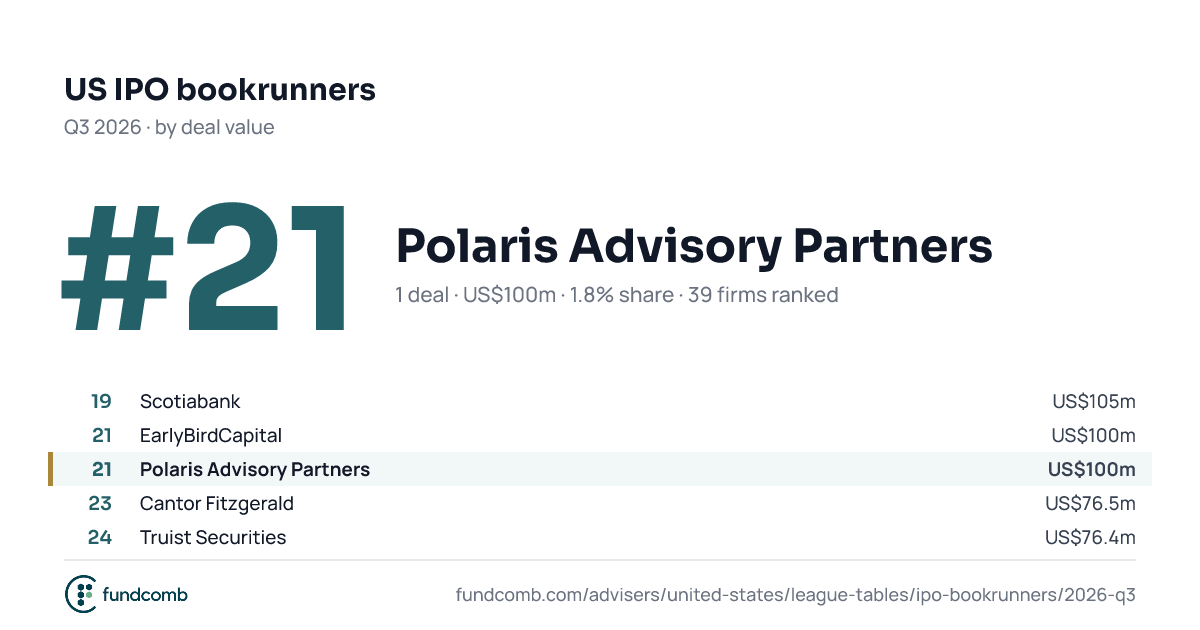
| 21 | Polaris Advisory Partners 1 deal · 1.8% share · new | 100.0 | 1.8% | New | |
| |||||
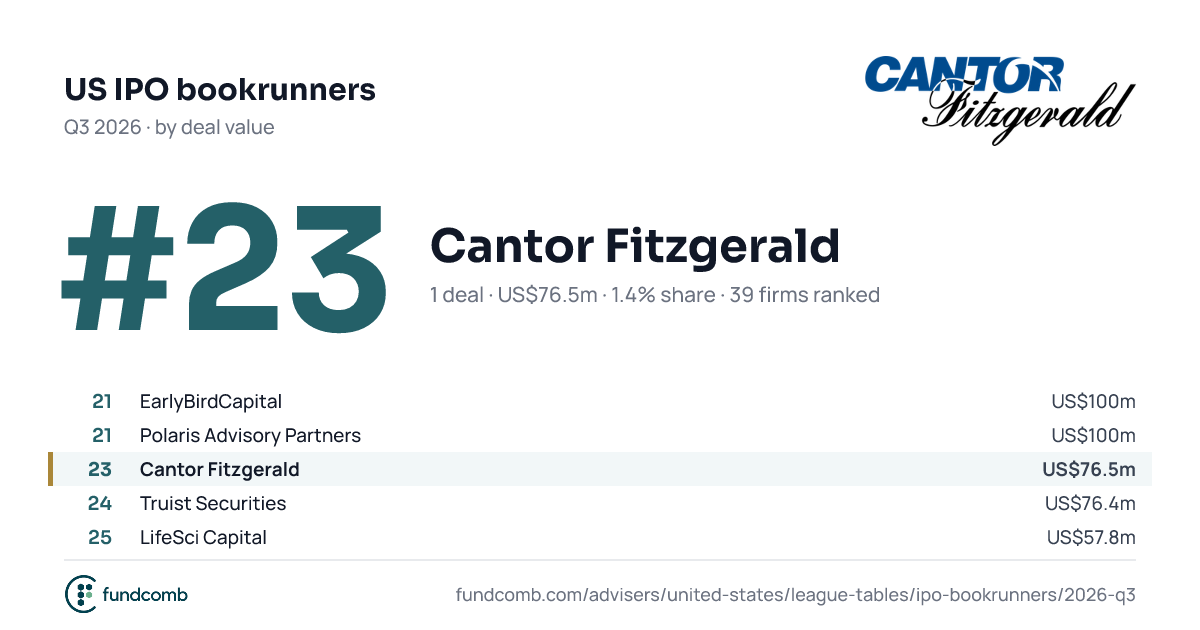
| 23 | Cantor Fitzgerald 1 deal · 1.4% share · new | 76.5 | 1.4% | New | |
| |||||
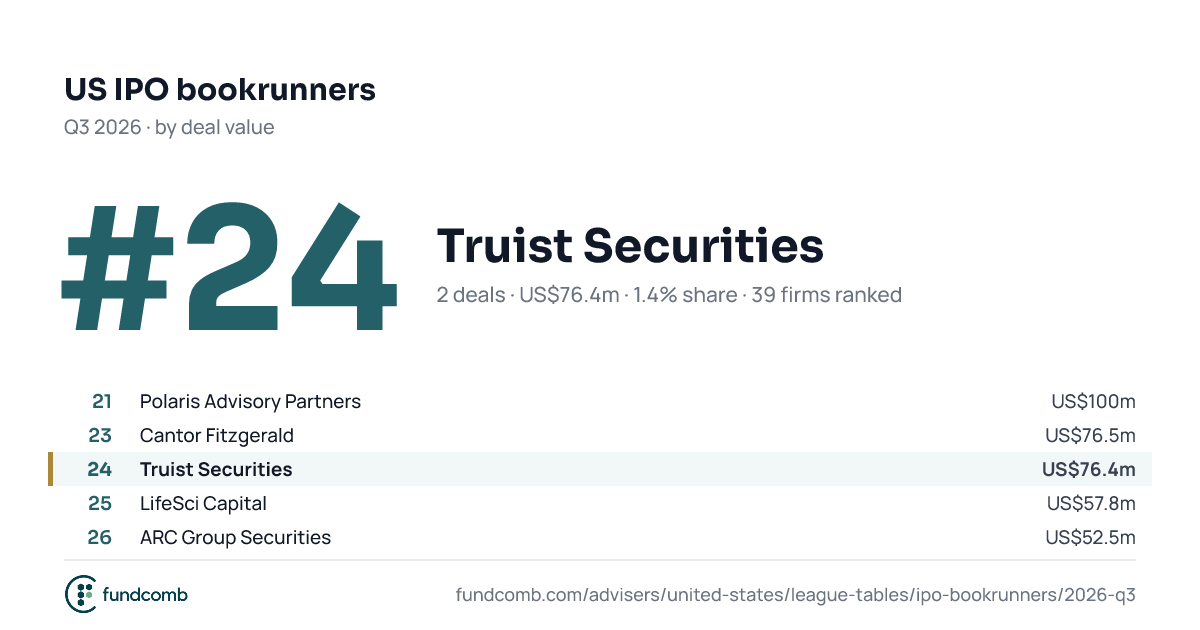
| 24 | Truist Securities 2 deals · 1.4% share · new | 76.4 | 1.4% | New | |
| |||||
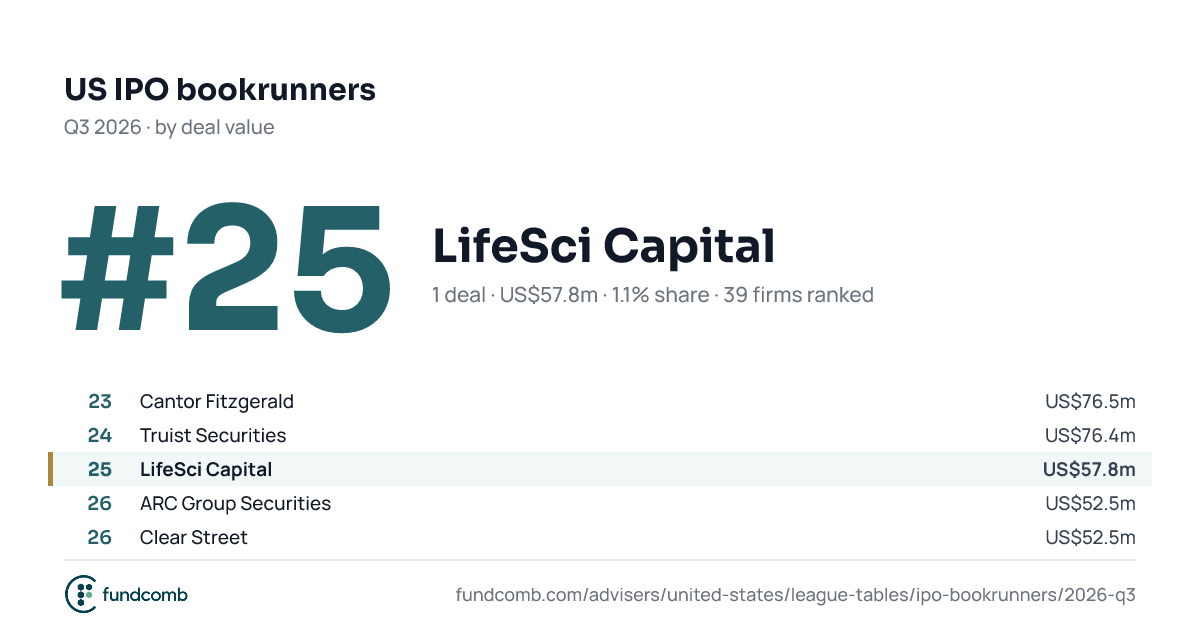
| 25 | LifeSci Capital 1 deal · 1.1% share · new | 57.8 | 1.1% | New | |
| |||||
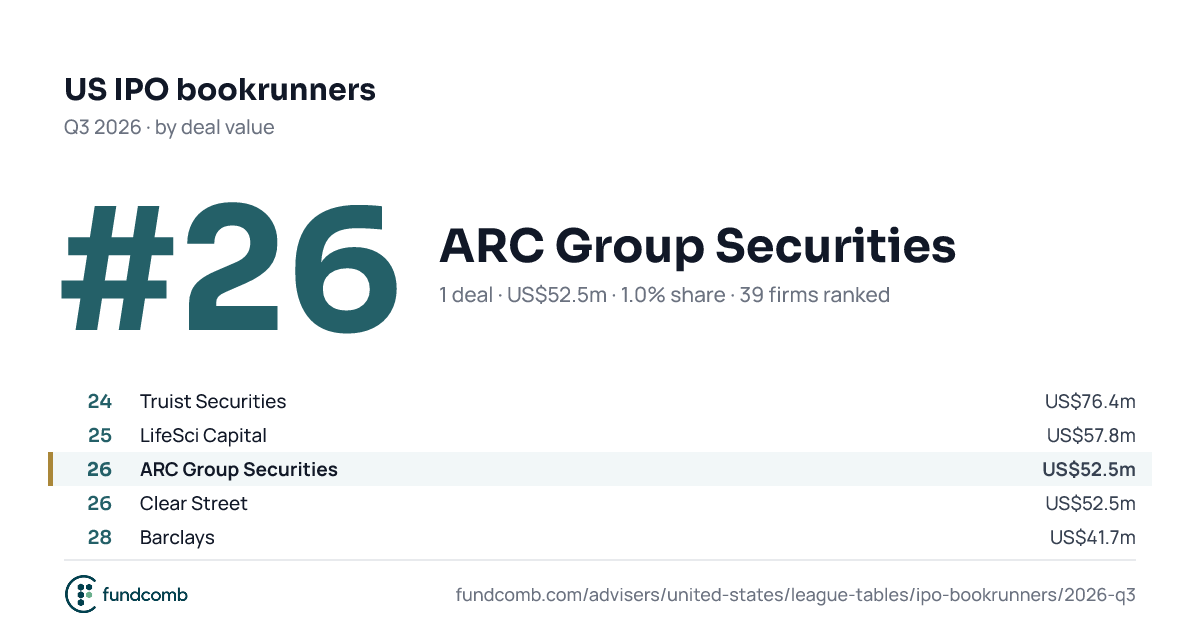
| 26 | ARC Group Securities 1 deal · 1.0% share · new | 52.5 | 1.0% | New | |
| |||||
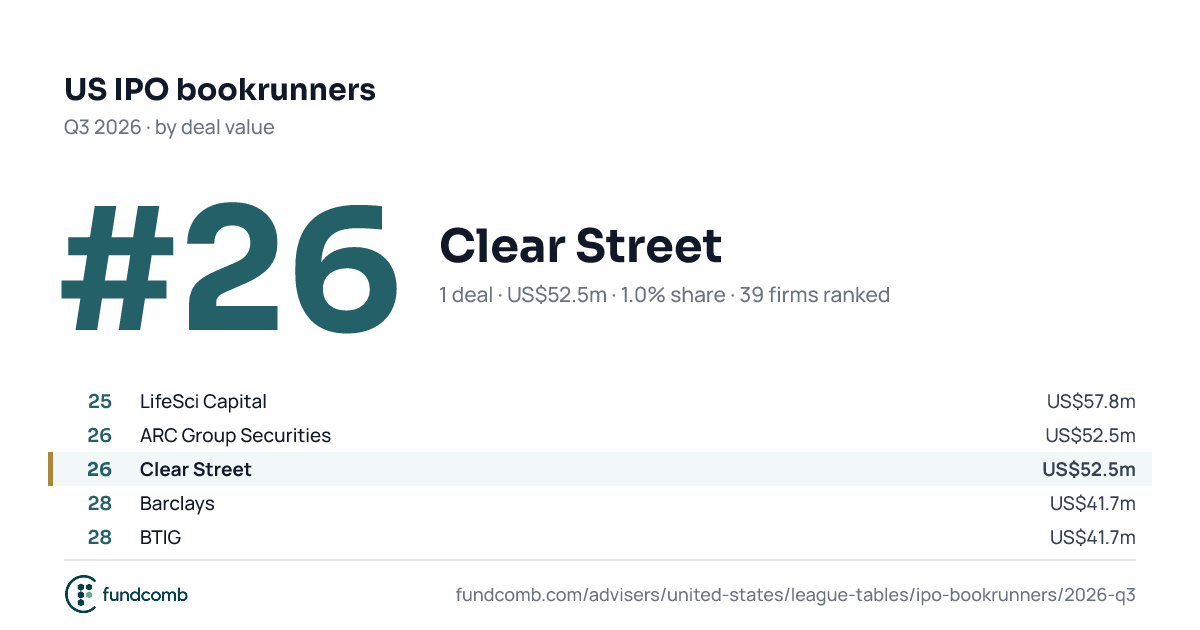
| 26 | Clear Street 1 deal · 1.0% share · new | 52.5 | 1.0% | New | |
| |||||
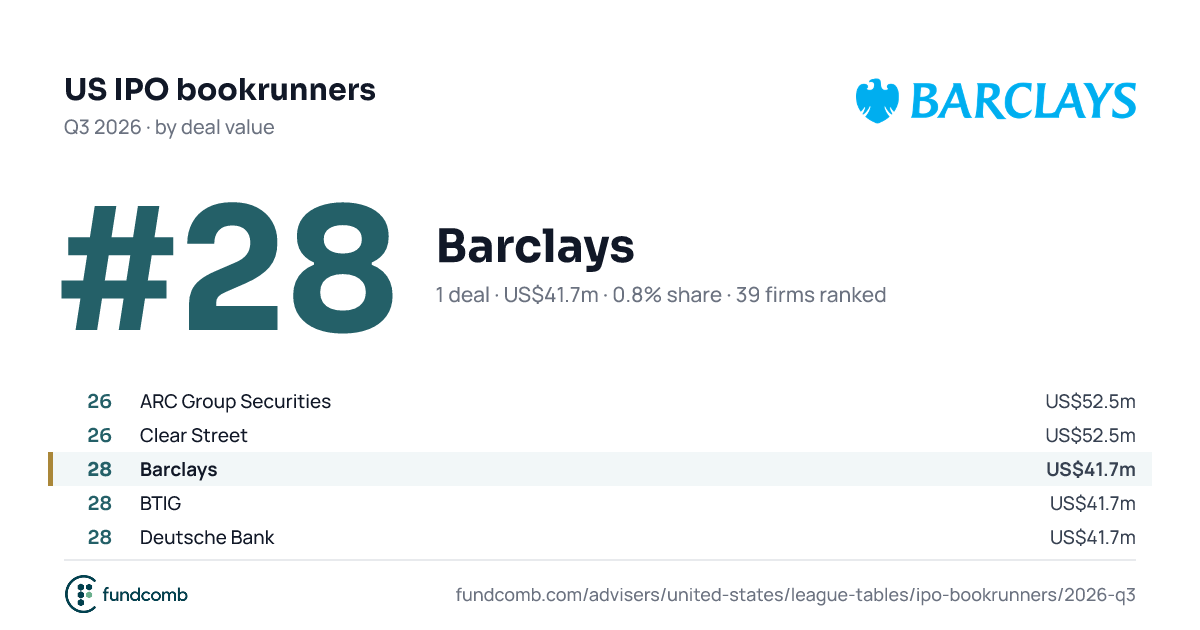
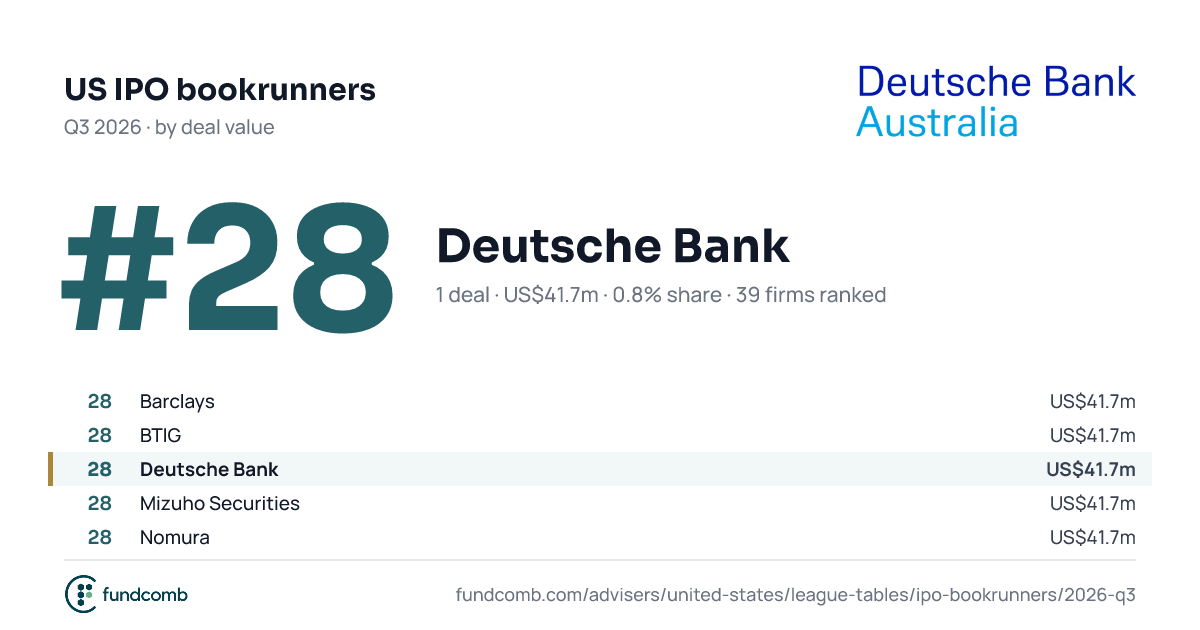
| 28 | Barclays 1 deal · 0.8% share · new | 41.7 | 0.8% | New | |
| |||||
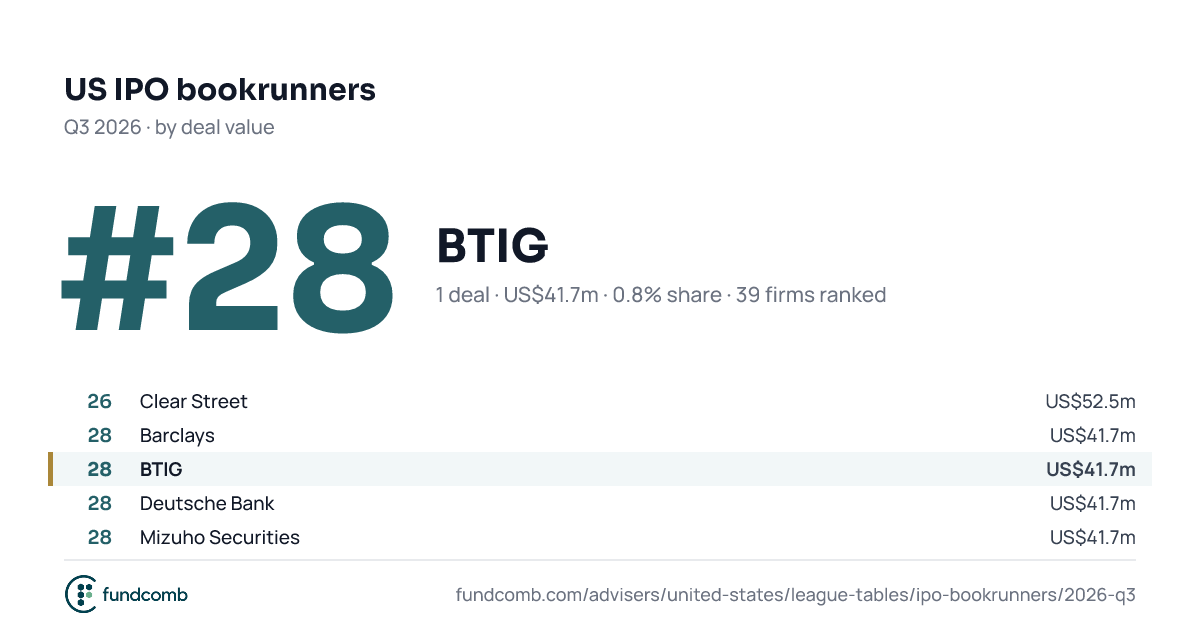
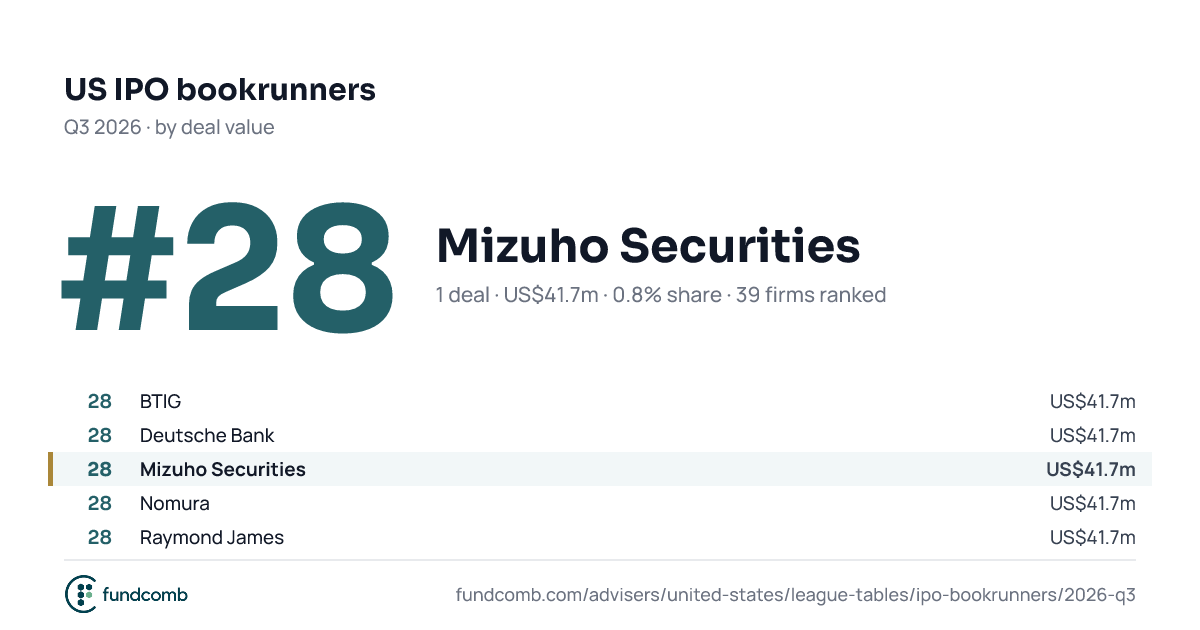
| 28 | BTIG 1 deal · 0.8% share · new | 41.7 | 0.8% | New | |
| |||||
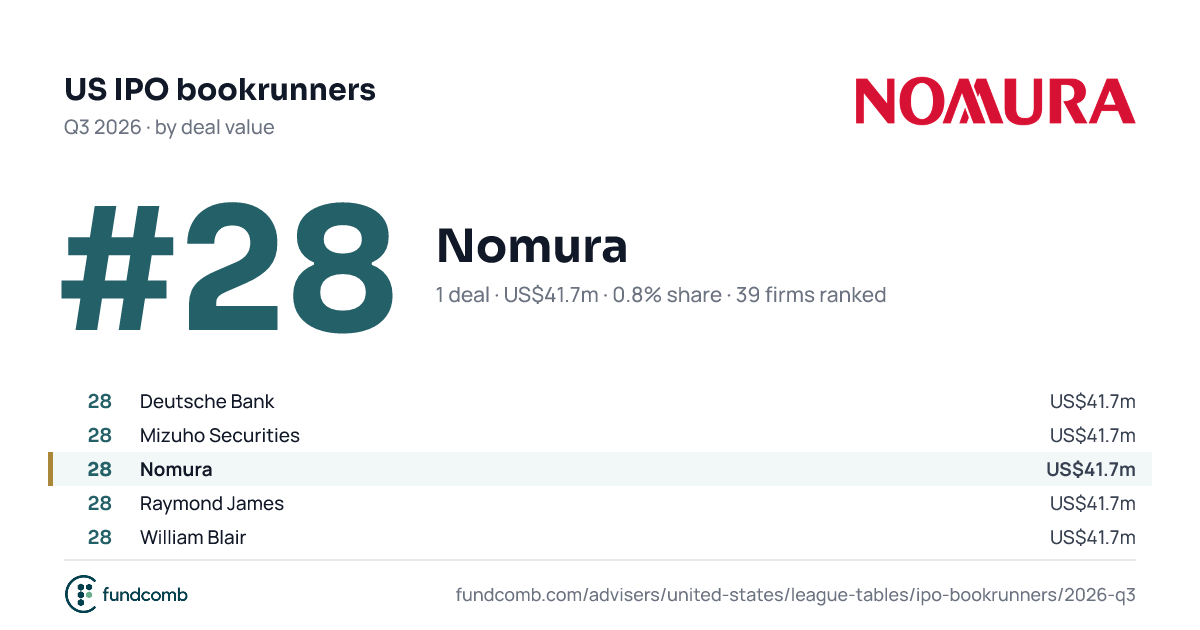
| 28 | Deutsche Bank 1 deal · 0.8% share · new | 41.7 | 0.8% | New | |
| |||||
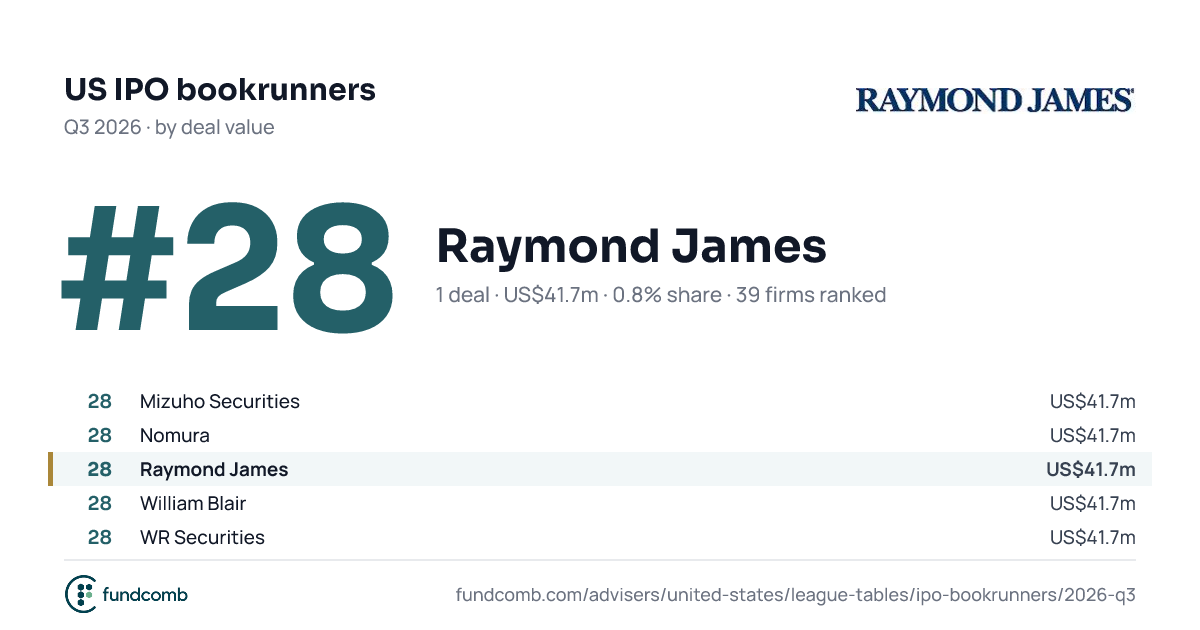
| 28 | Mizuho Securities 1 deal · 0.8% share · new | 41.7 | 0.8% | New | |
| |||||
| 28 | Nomura 1 deal · 0.8% share · new | 41.7 | 0.8% | New | |
| |||||
| 28 | Raymond James 1 deal · 0.8% share · new | 41.7 | 0.8% | New | |
| |||||
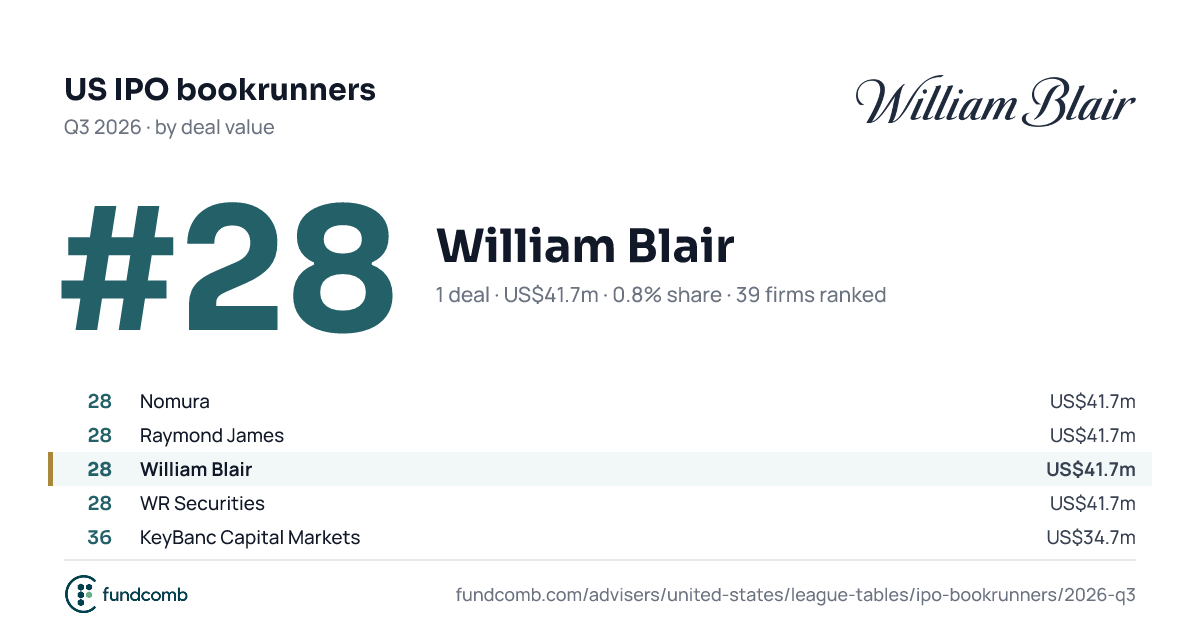
| 28 | William Blair 1 deal · 0.8% share · new | 41.7 | 0.8% | New | |
| |||||
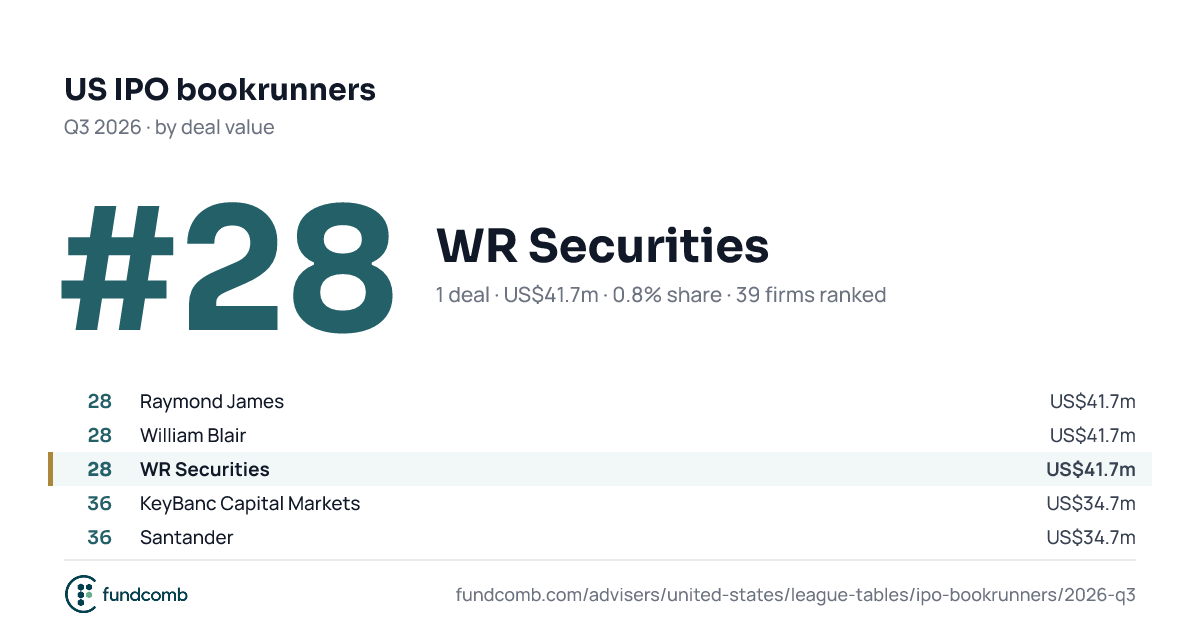
| 28 | WR Securities 1 deal · 0.8% share · new | 41.7 | 0.8% | New | |
| |||||
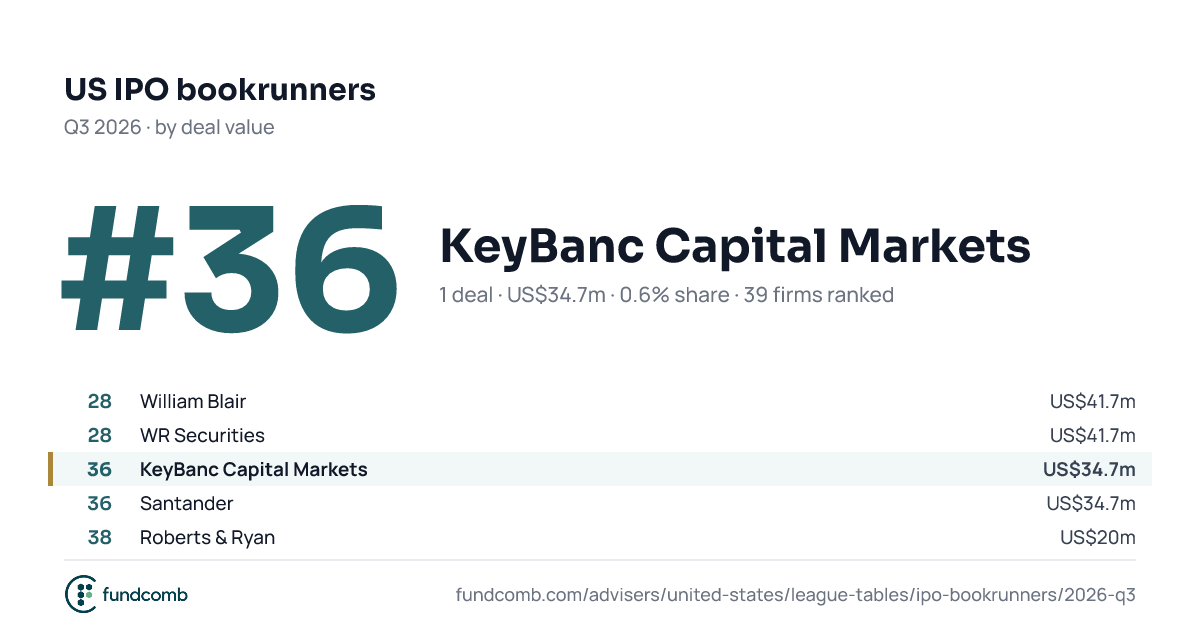
| 36 | KeyBanc Capital Markets 1 deal · 0.6% share · new | 34.7 | 0.6% | New | |
| |||||
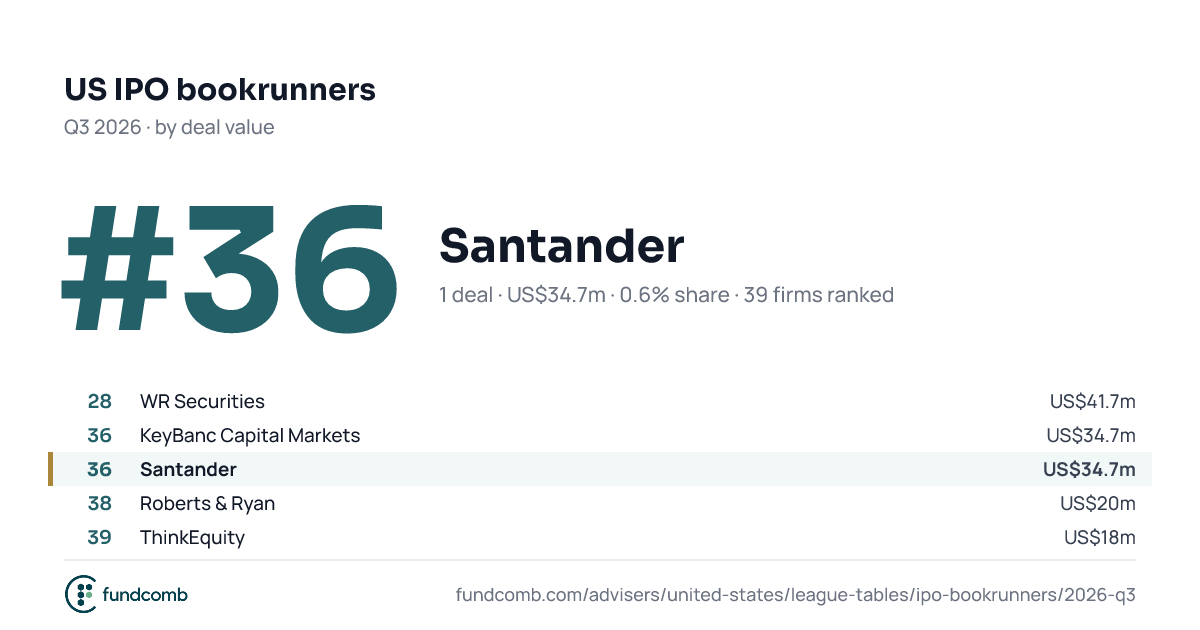
| 36 | Santander 1 deal · 0.6% share · new | 34.7 | 0.6% | New | |
| |||||
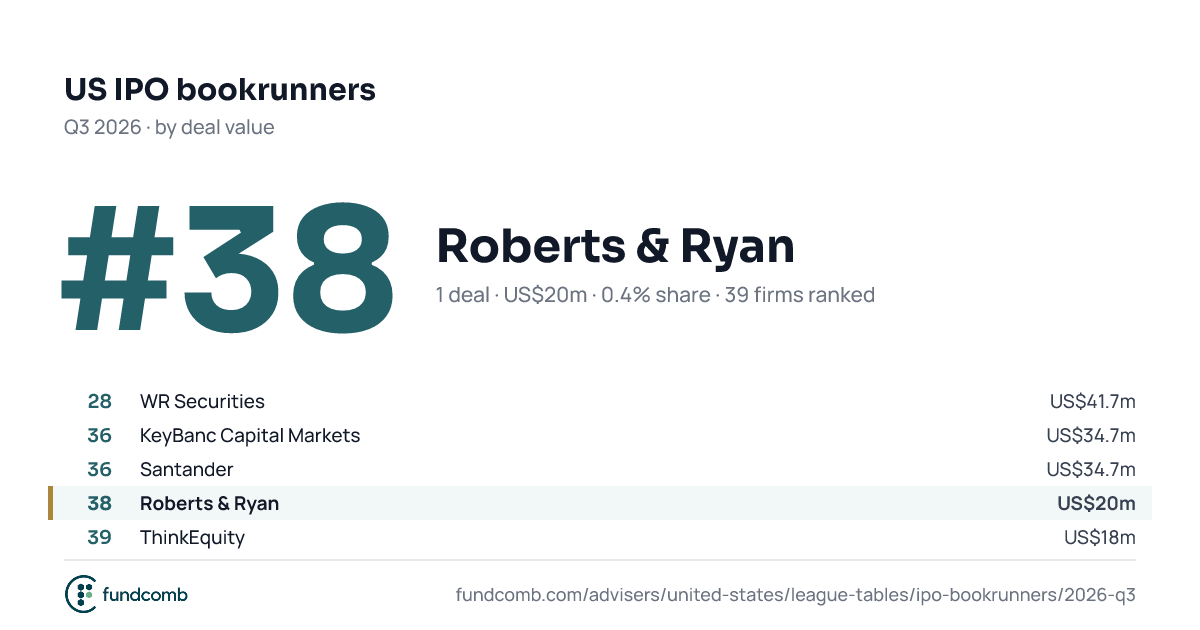
| 38 | Roberts & Ryan 1 deal · 0.4% share · new | 20.0 | 0.4% | New | |
| |||||
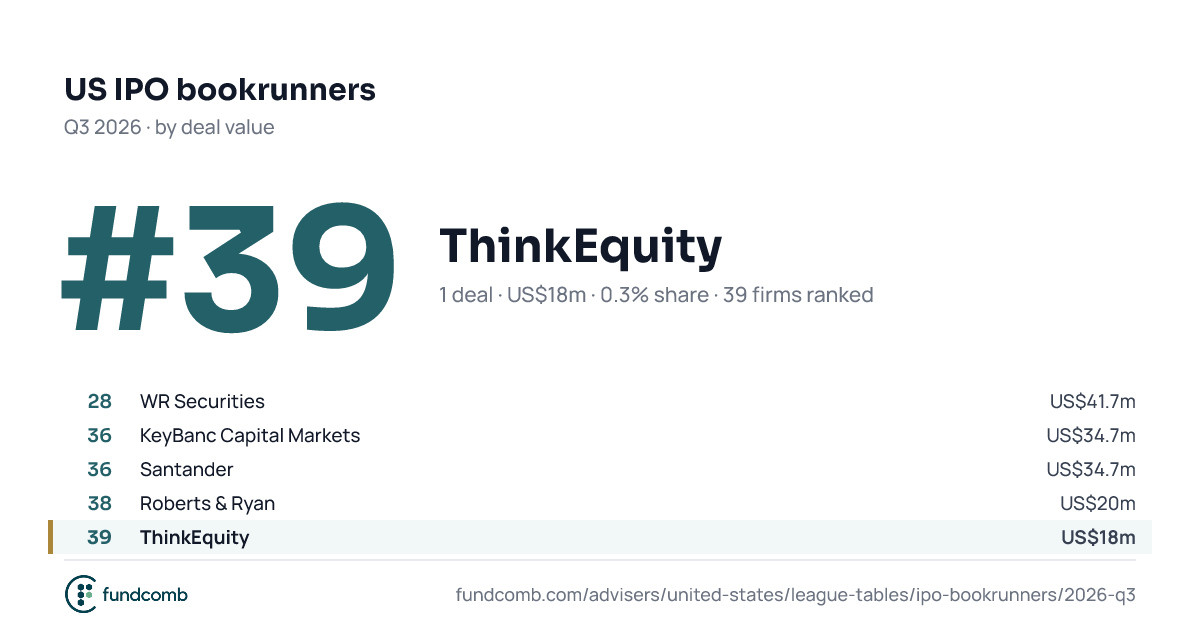
| 39 | ThinkEquity 1 deal · 0.3% share · new | 18.0 | 0.3% | New | |
| |||||
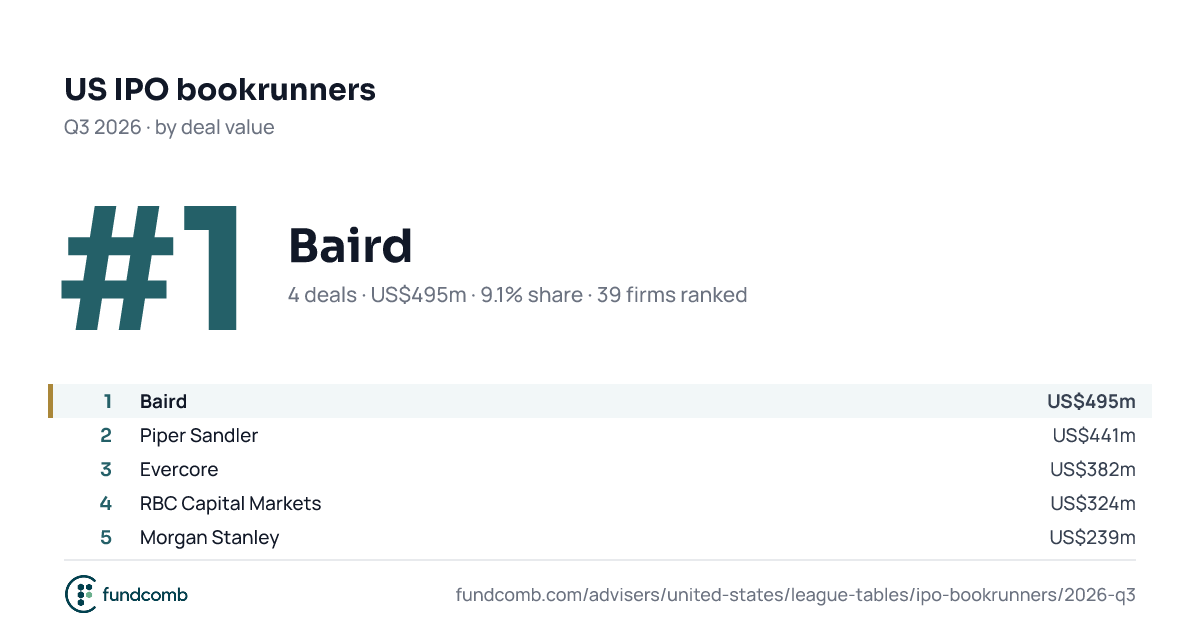
Top ten by deal value.
This table's top firms in each year.
Value is shared equally among the lead managers on each deal. Q3 2025 rank is the firm's place in the same period a year earlier, under the same filters. Methodology