
IPO lead managers
Calendar 2025 · IPOs listed · 21 deals · A$2.5bn disclosed
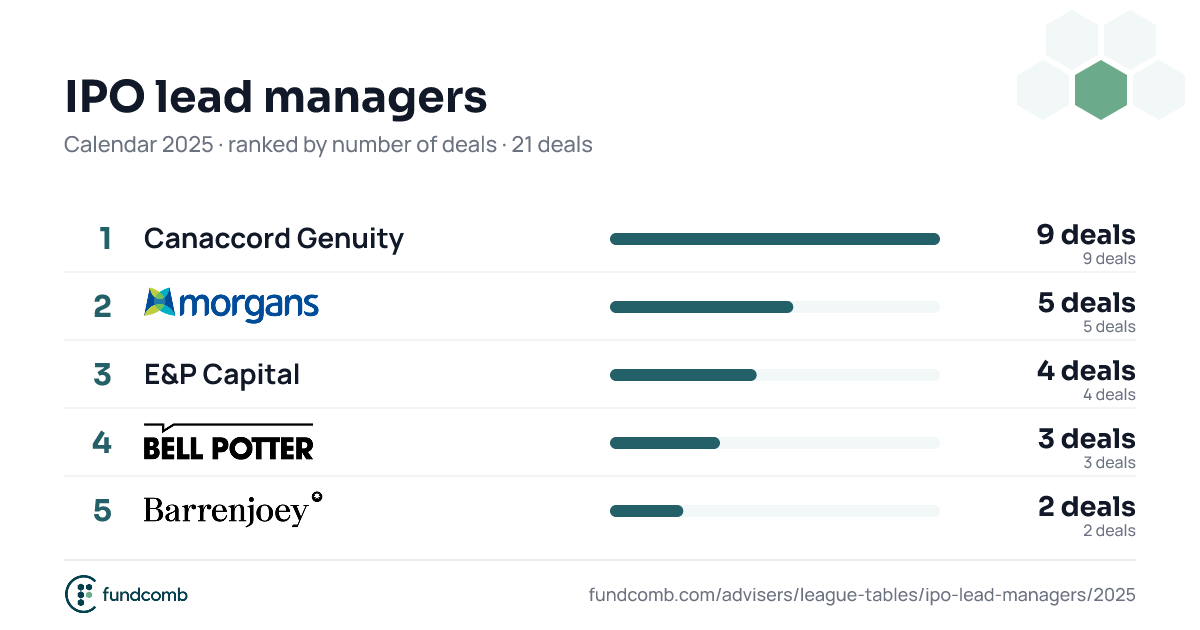
| 1 | Canaccord Genuity A$283m · 42.9% share | 282.5 | 42.9% | |
| ||||
| 2 | Morgans A$277m · 23.8% share | 276.9 | 23.8% | |
| ||||
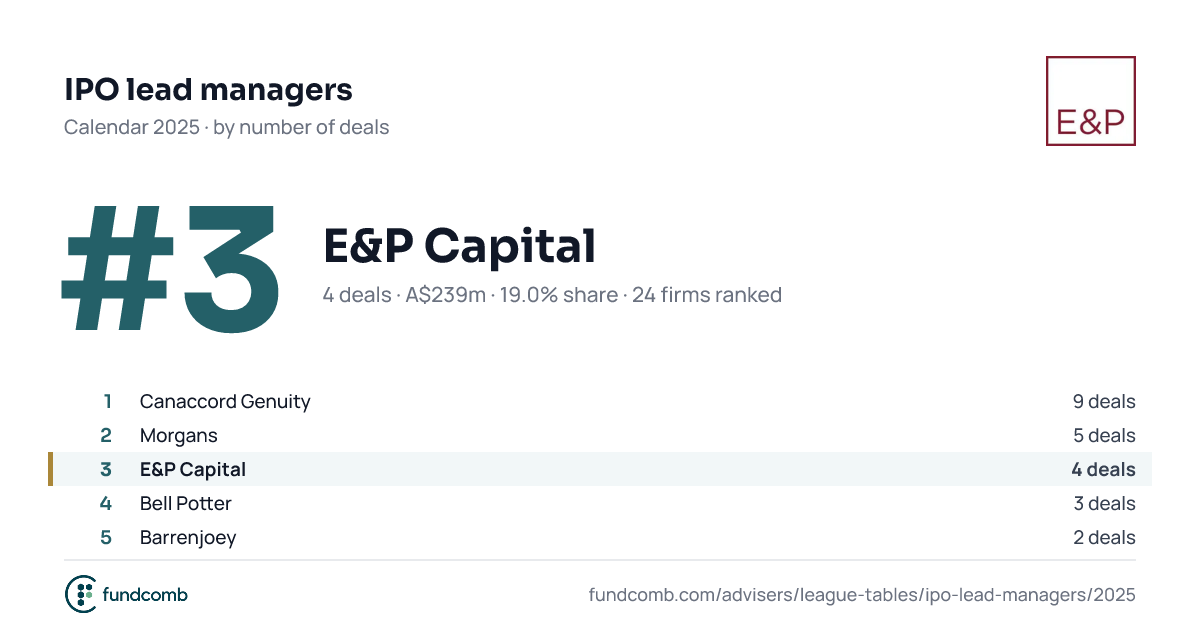
| 3 | E&P Capital A$239m · 19.0% share | 239.4 | 19.0% | |
| ||||
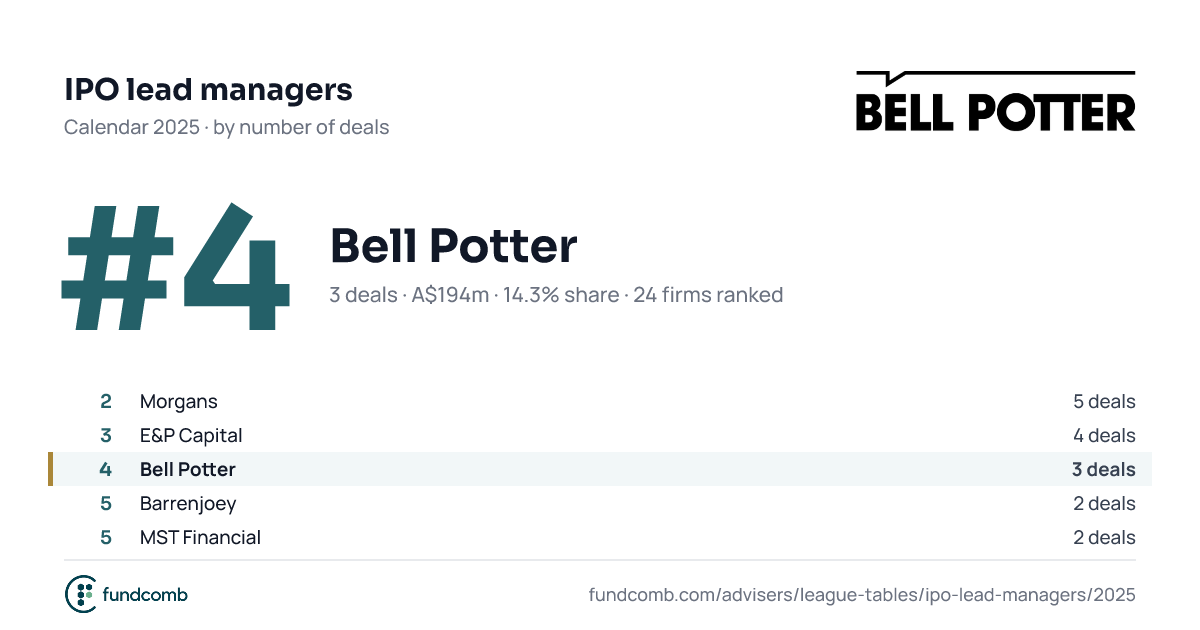
| 4 | Bell Potter A$194m · 14.3% share | 194.4 | 14.3% | |
| ||||
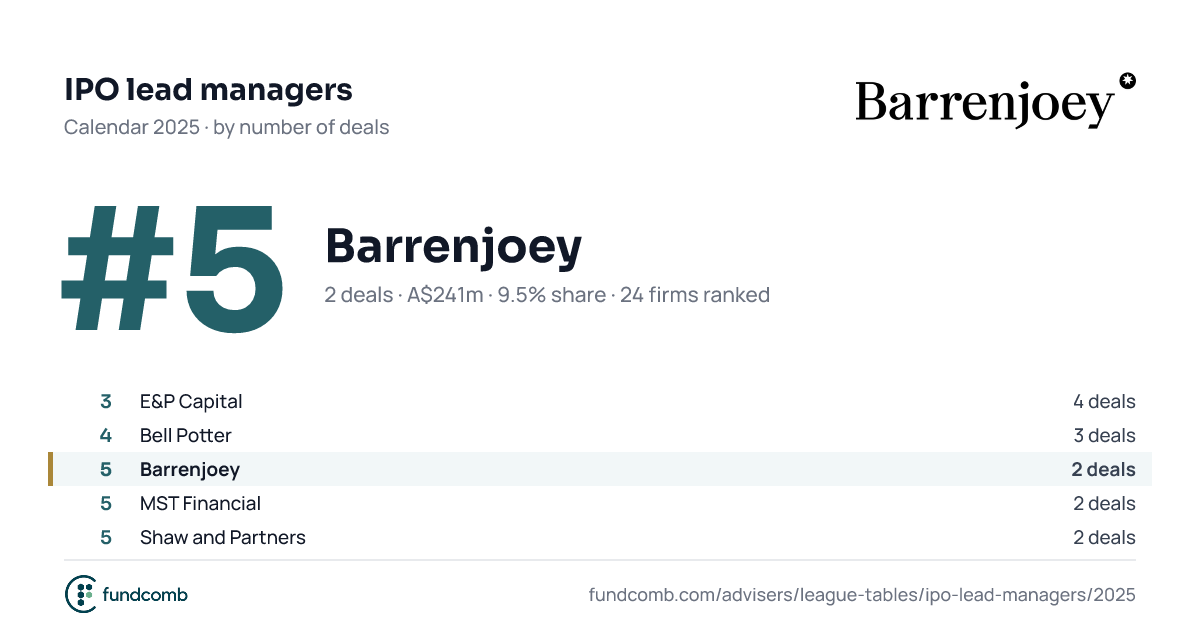
| 5 | Barrenjoey A$241m · 9.5% share | 240.8 | 9.5% | |
| ||||
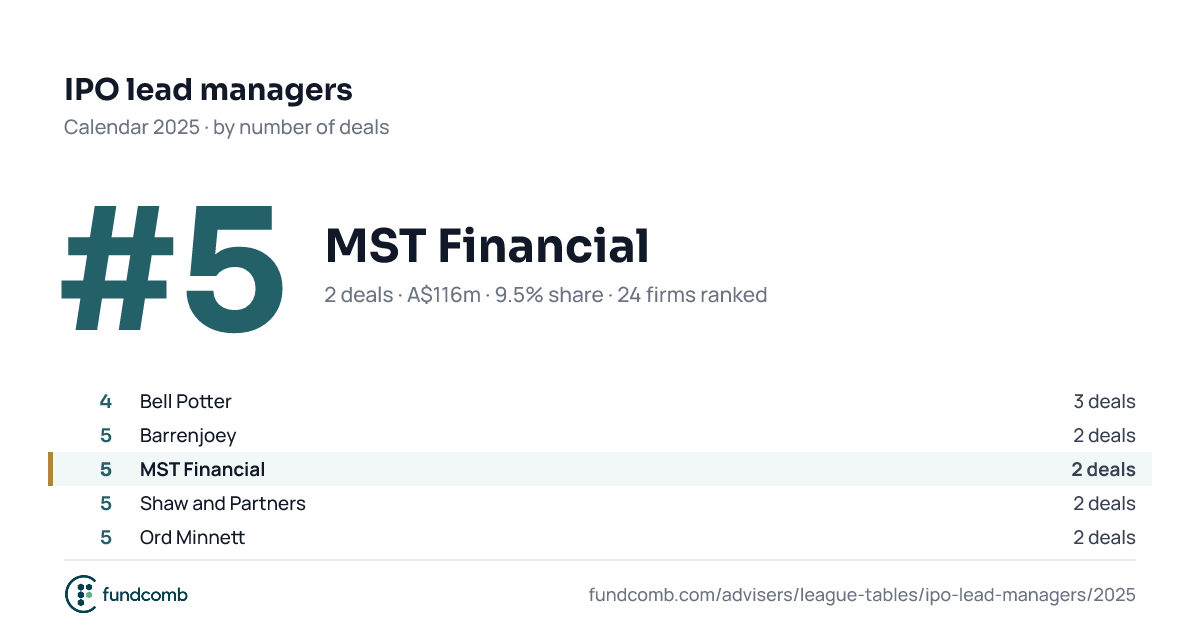
| 5 | MST Financial A$116m · 9.5% share | 116.0 | 9.5% | |
| ||||
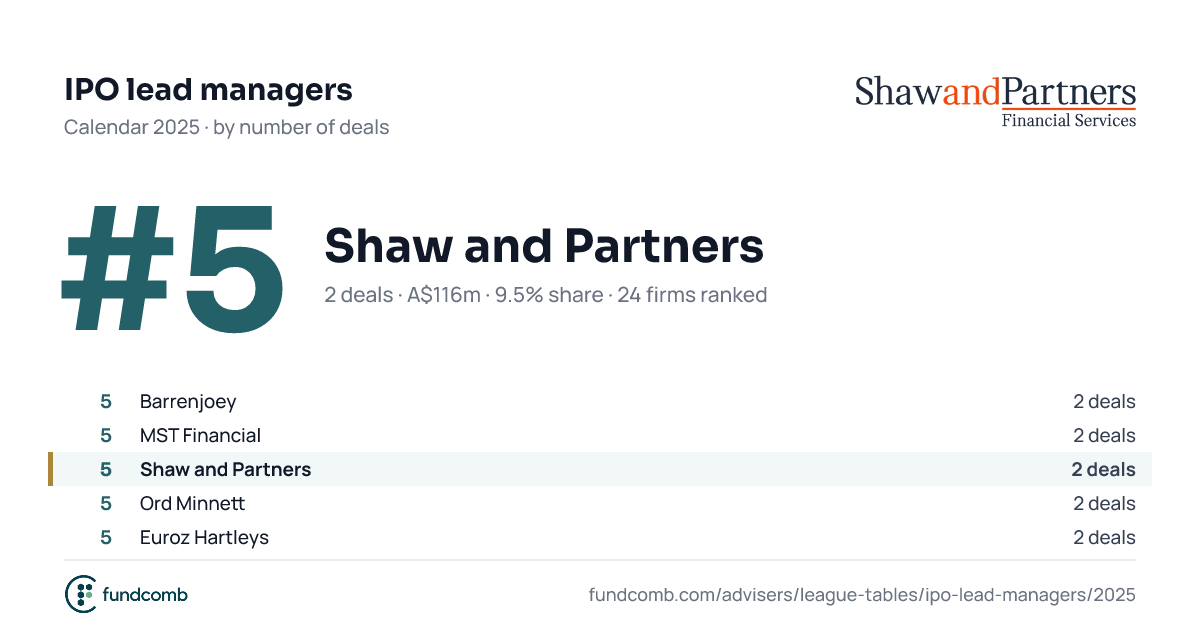
| 5 | Shaw and Partners A$116m · 9.5% share | 116.0 | 9.5% | |
| ||||
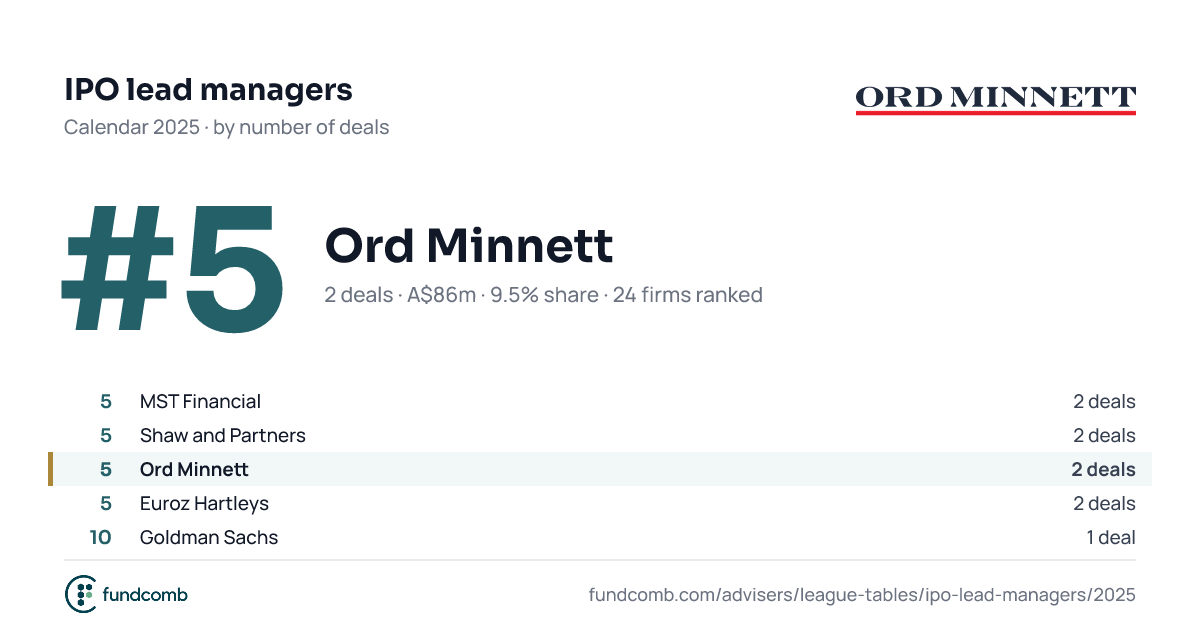
| 5 | Ord Minnett A$86m · 9.5% share | 86.0 | 9.5% | |
| ||||
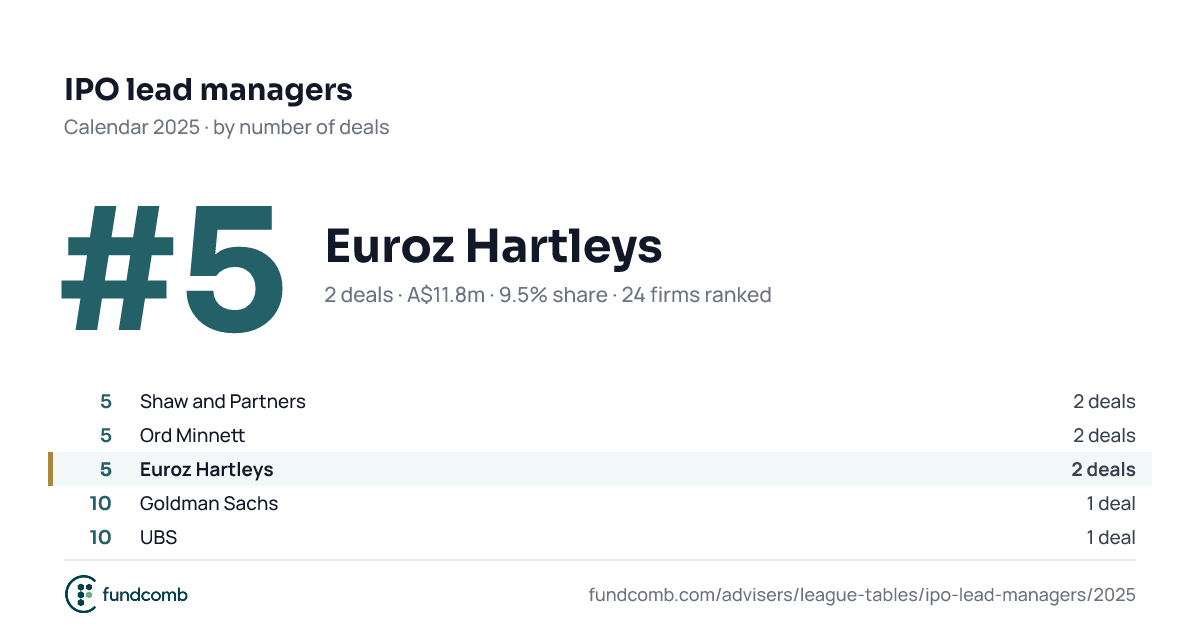
| 5 | Euroz Hartleys A$11.8m · 9.5% share | 11.8 | 9.5% | |
| ||||
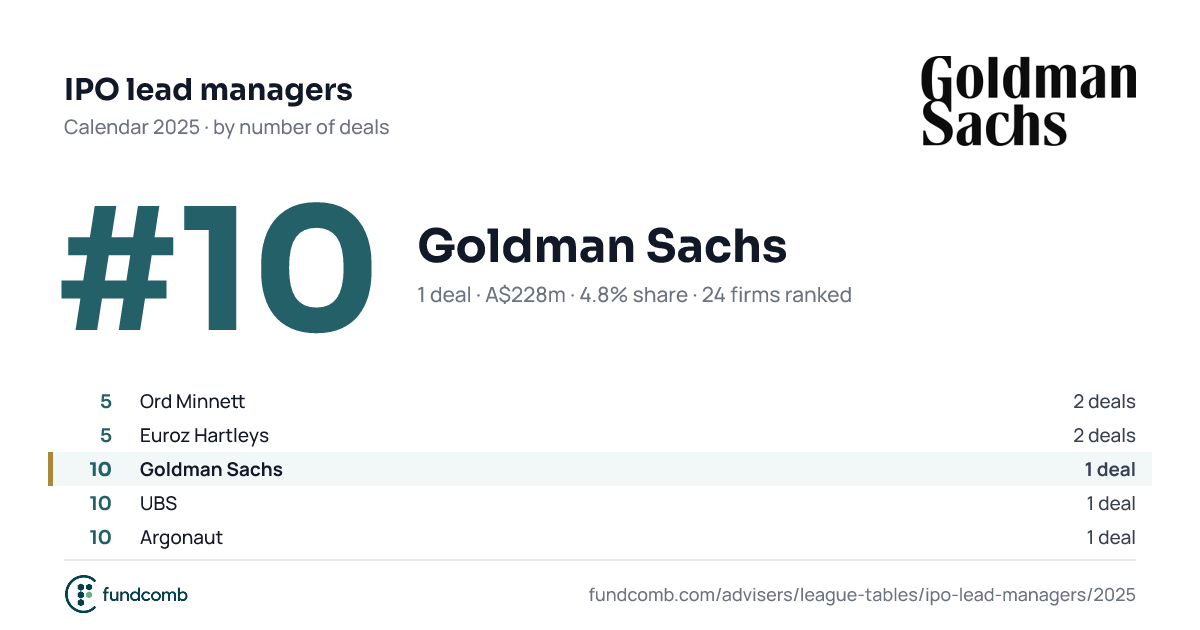
| 10 | Goldman Sachs A$228m · 4.8% share | 228.3 | 4.8% | |
| ||||
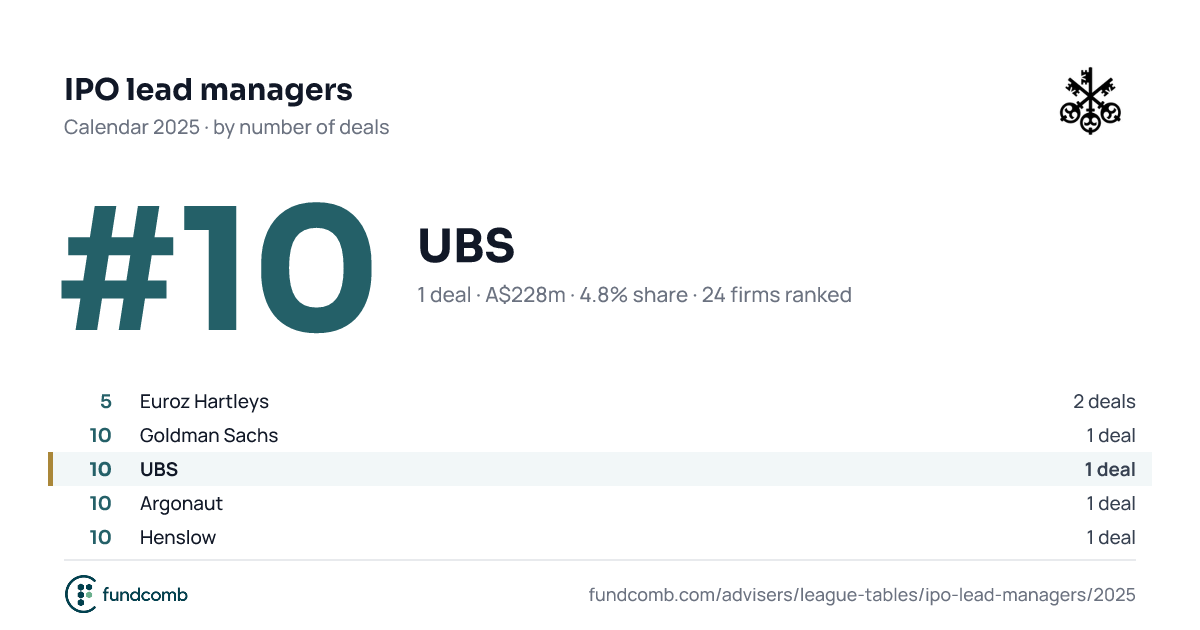
| 10 | UBS A$228m · 4.8% share | 228.3 | 4.8% | |
| ||||
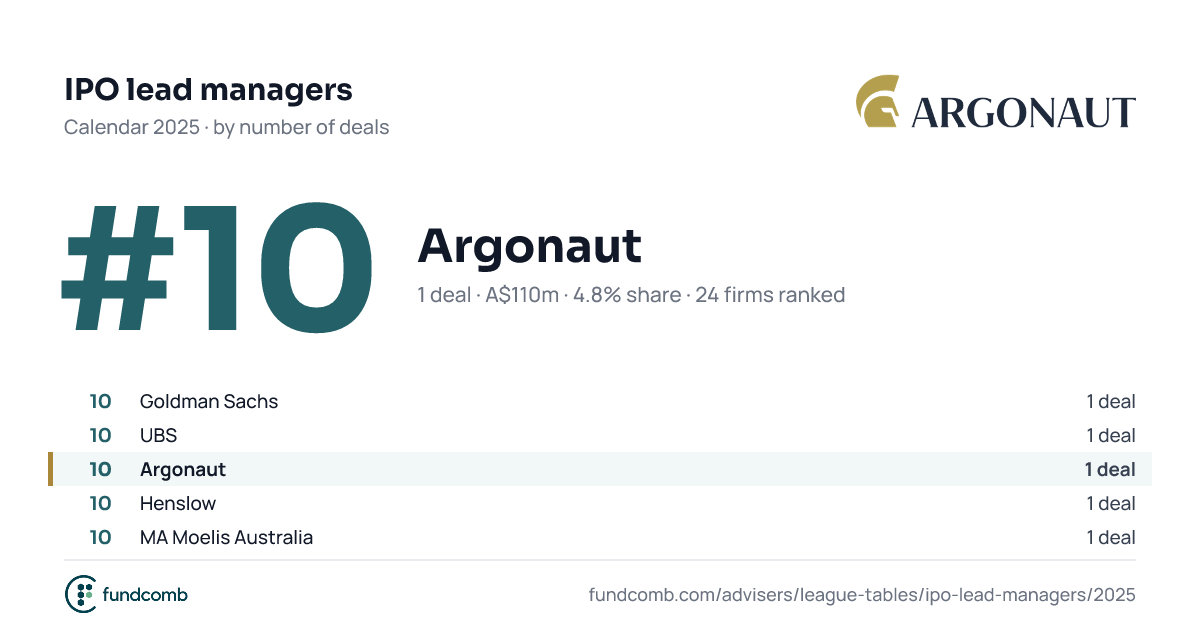
| 10 | Argonaut A$110m · 4.8% share | 110.0 | 4.8% | |
| ||||
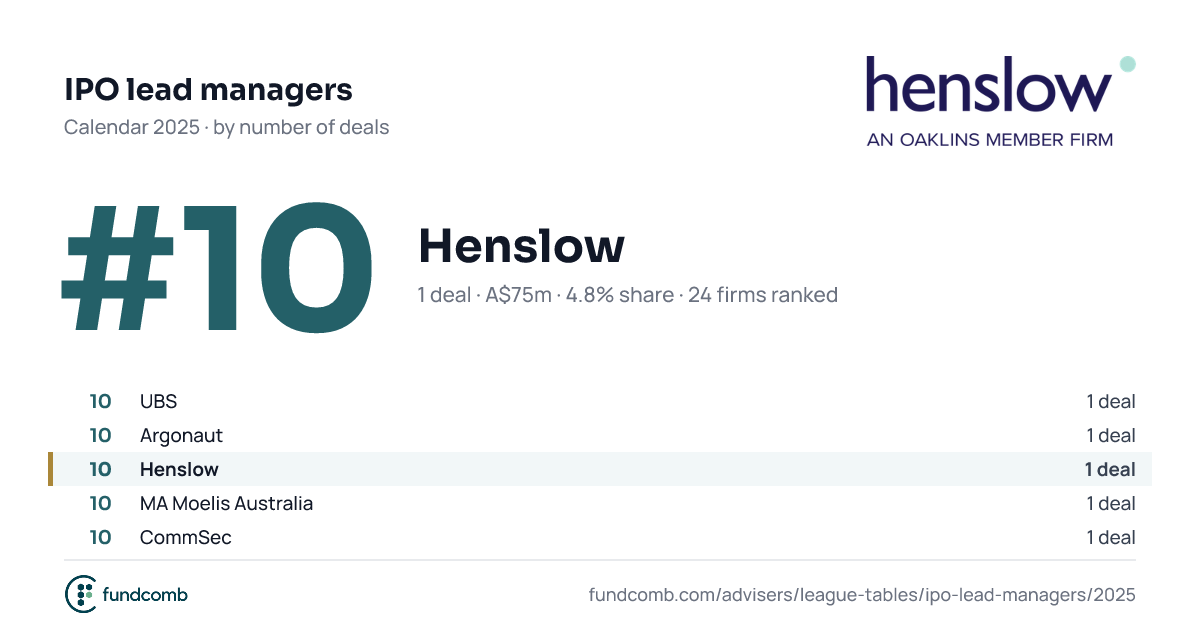
| 10 | Henslow A$75m · 4.8% share | 75.0 | 4.8% | |
| ||||
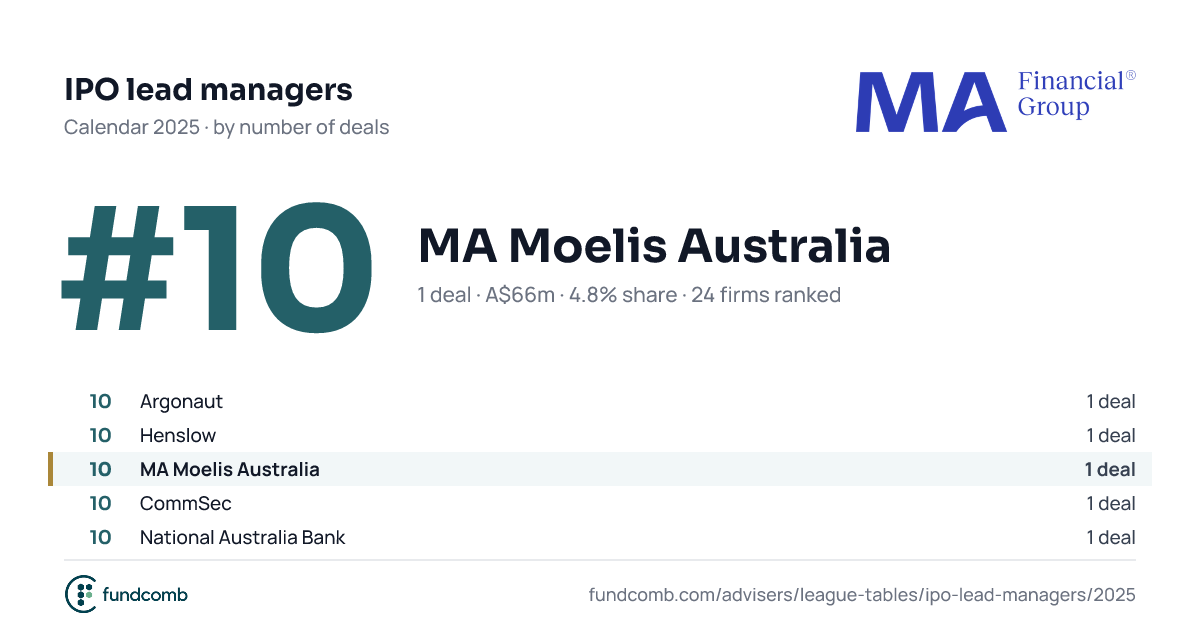
| 10 | MA Moelis Australia A$66m · 4.8% share | 66.0 | 4.8% | |
| ||||
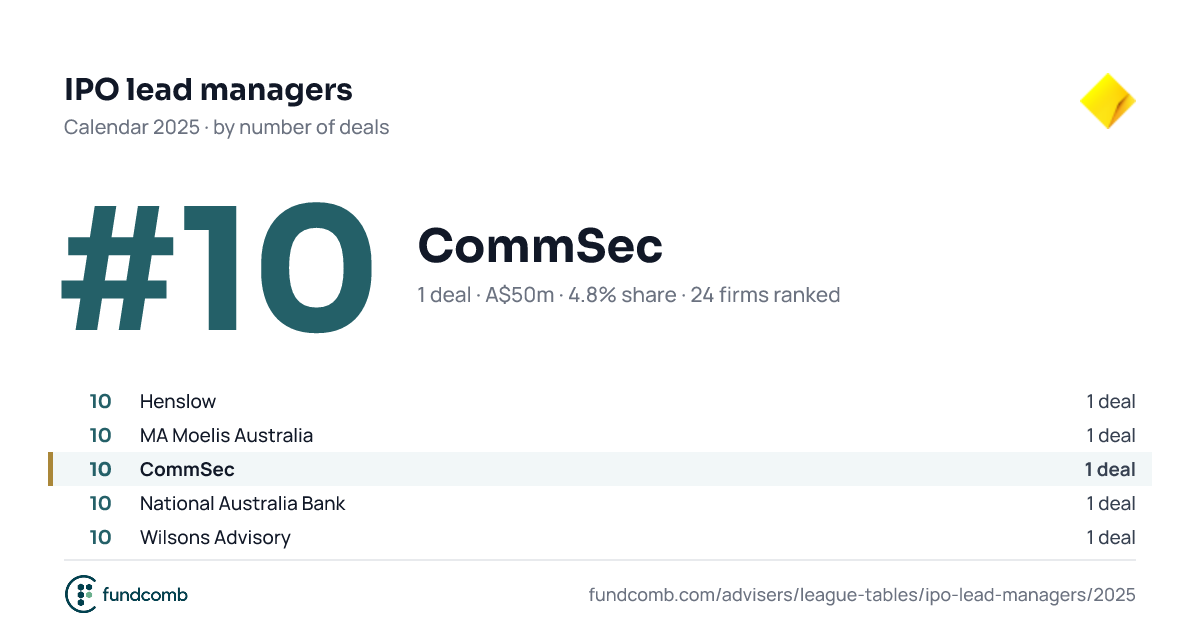
| 10 | CommSec A$50m · 4.8% share | 50.0 | 4.8% | |
| ||||
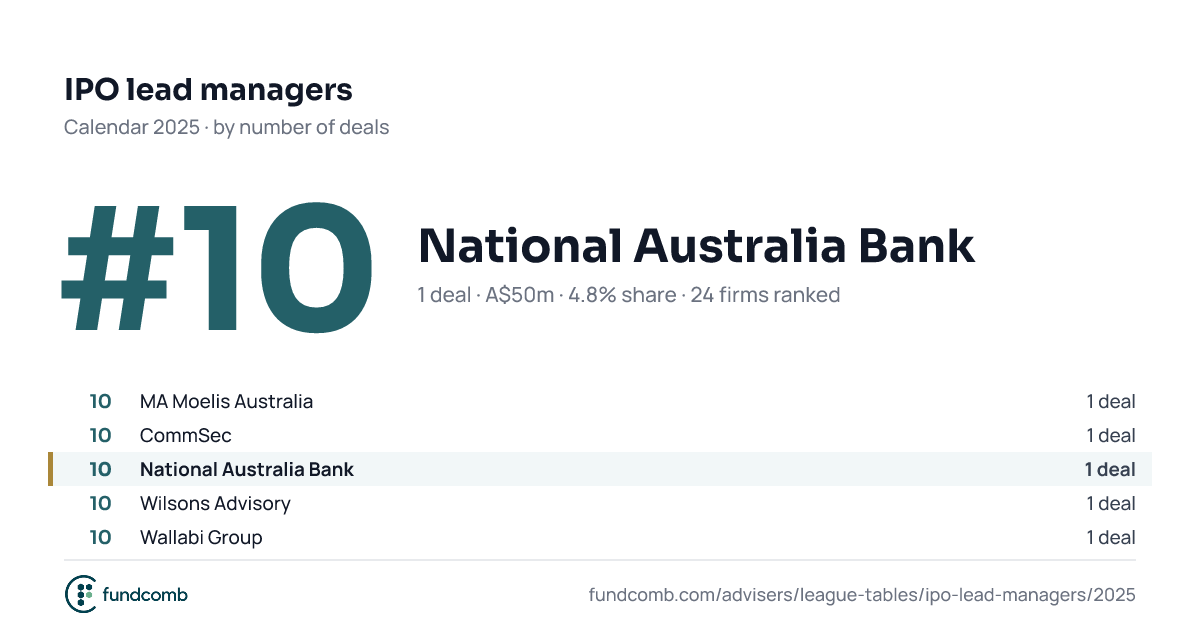
| 10 | National Australia Bank A$50m · 4.8% share | 50.0 | 4.8% | |
| ||||
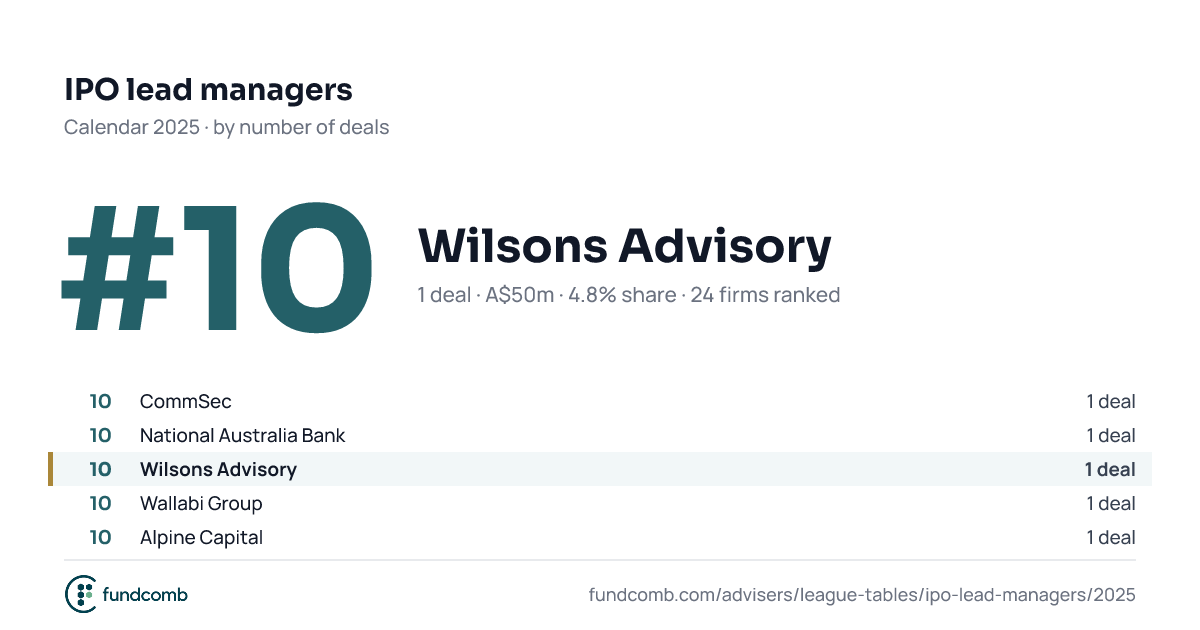
| 10 | Wilsons Advisory A$50m · 4.8% share | 50.0 | 4.8% | |
| ||||
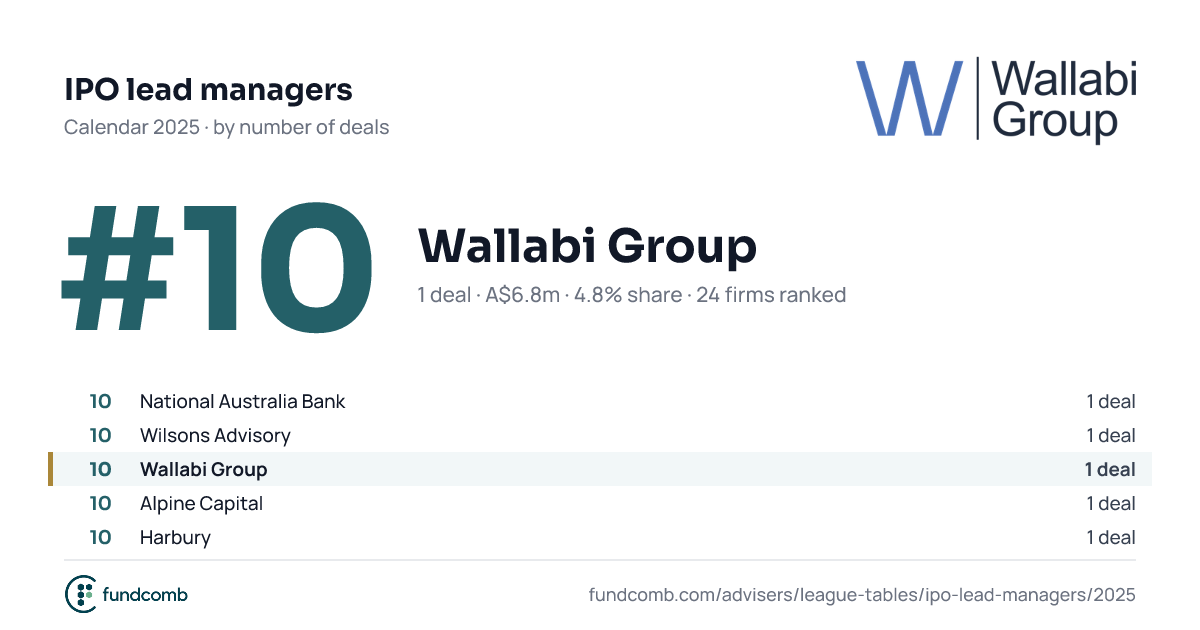
| 10 | Wallabi Group A$6.8m · 4.8% share | 6.8 | 4.8% | |
| ||||
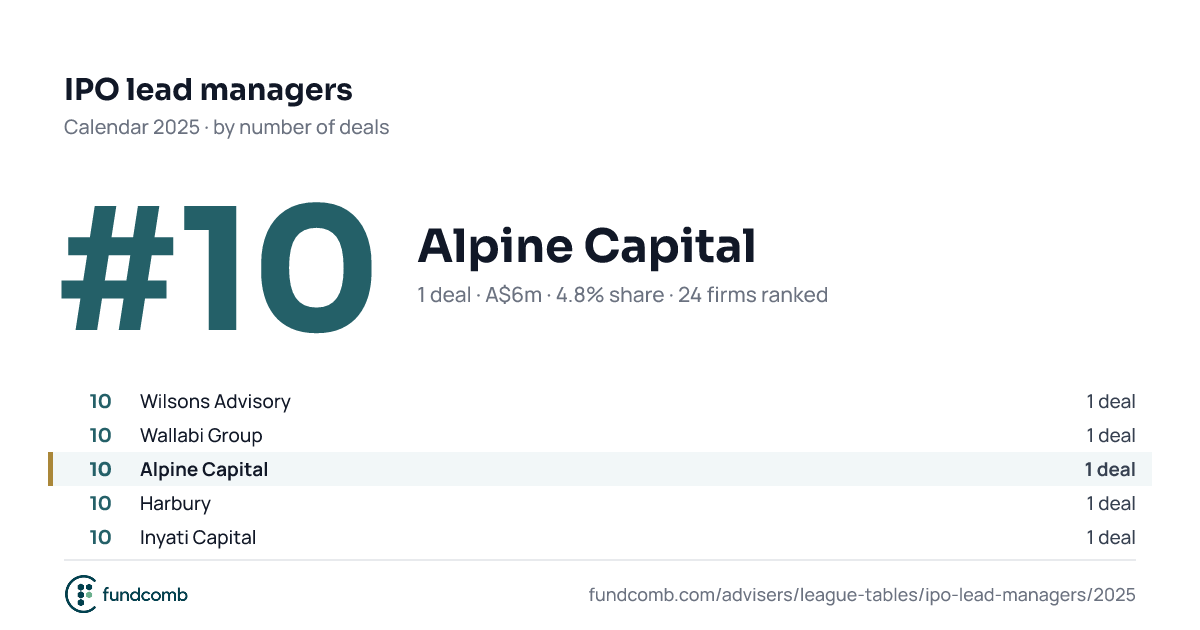
| 10 | Alpine Capital A$6m · 4.8% share | 6.0 | 4.8% | |
| ||||
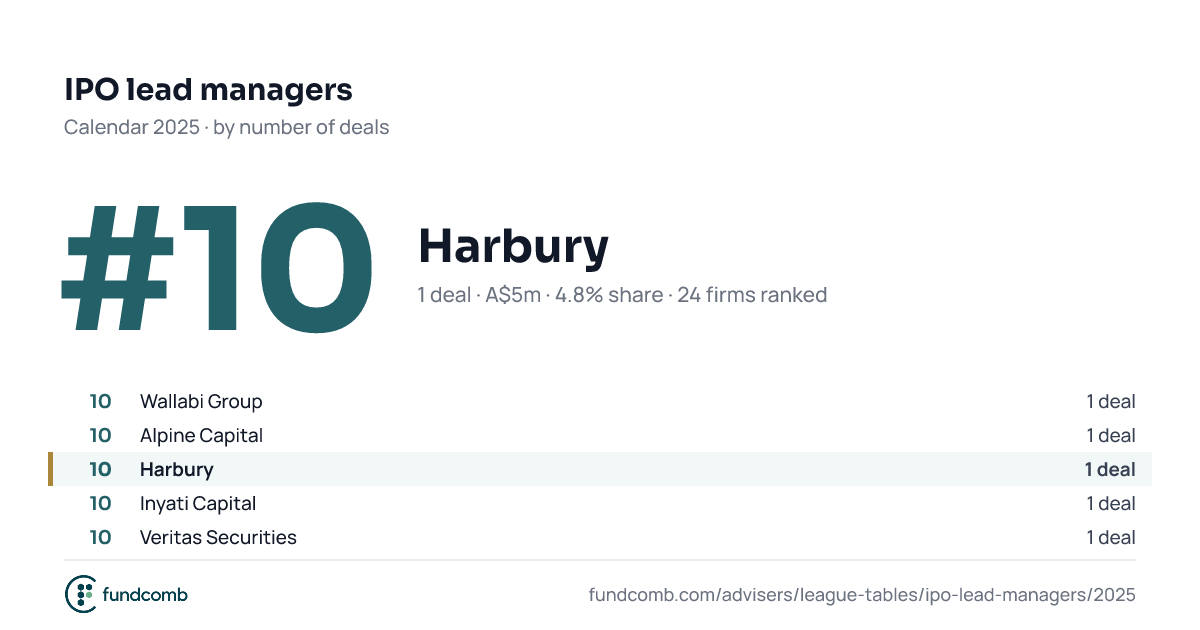
| 10 | Harbury A$5m · 4.8% share | 5.0 | 4.8% | |
| ||||
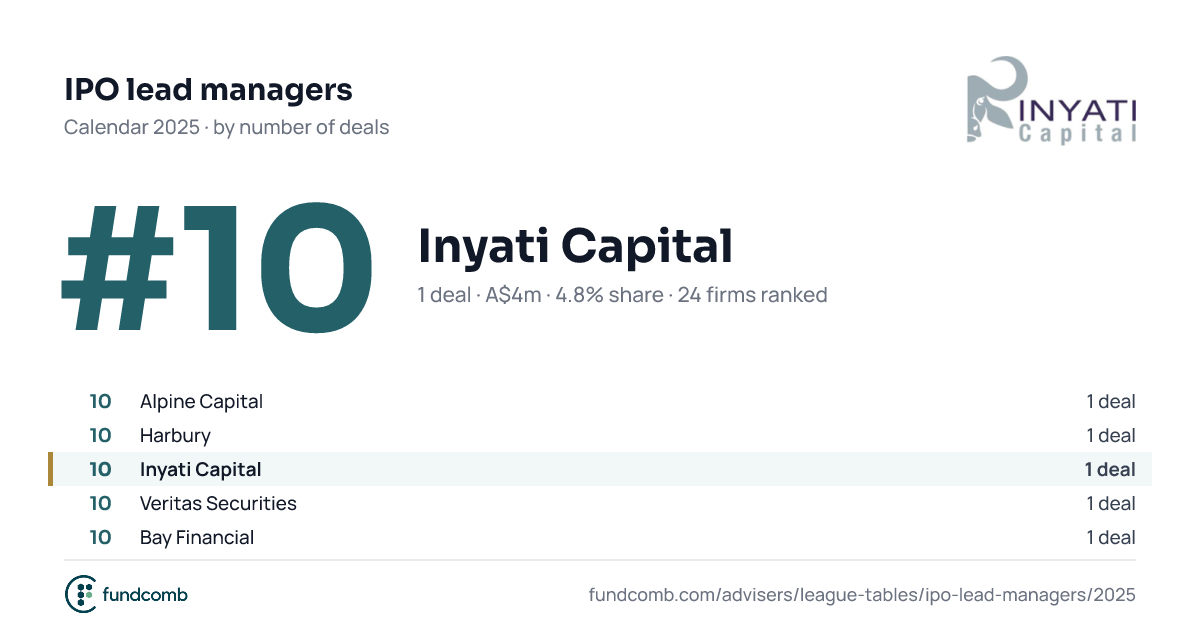
| 10 | Inyati Capital A$4m · 4.8% share | 4.0 | 4.8% | |
| ||||
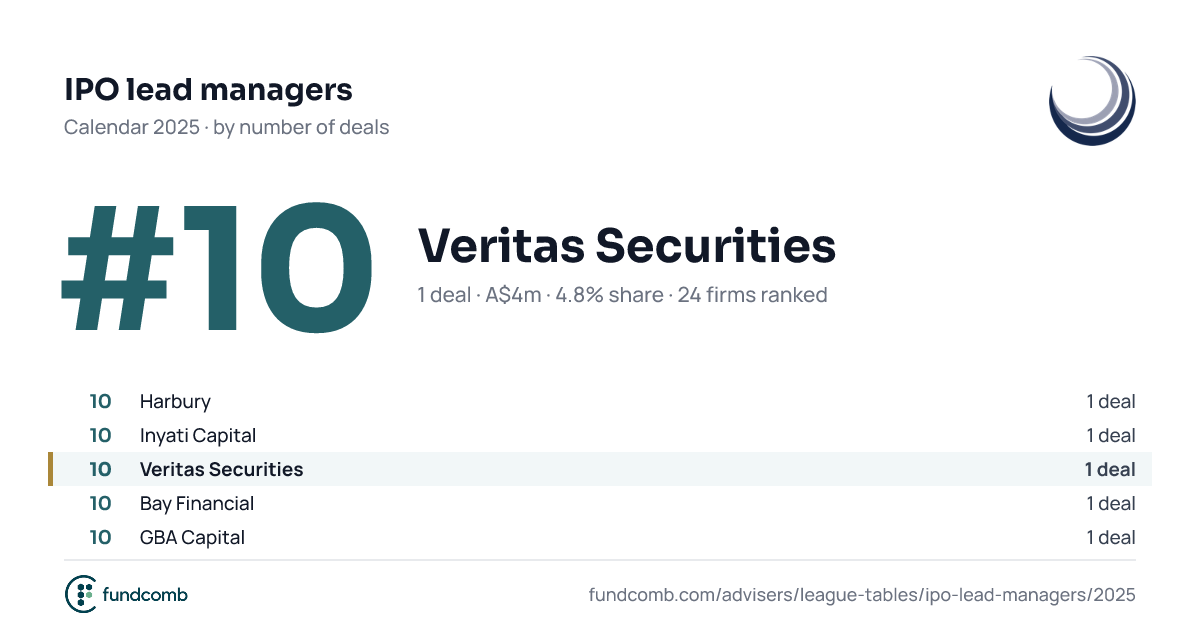
| 10 | Veritas Securities A$4m · 4.8% share | 4.0 | 4.8% | |
| ||||
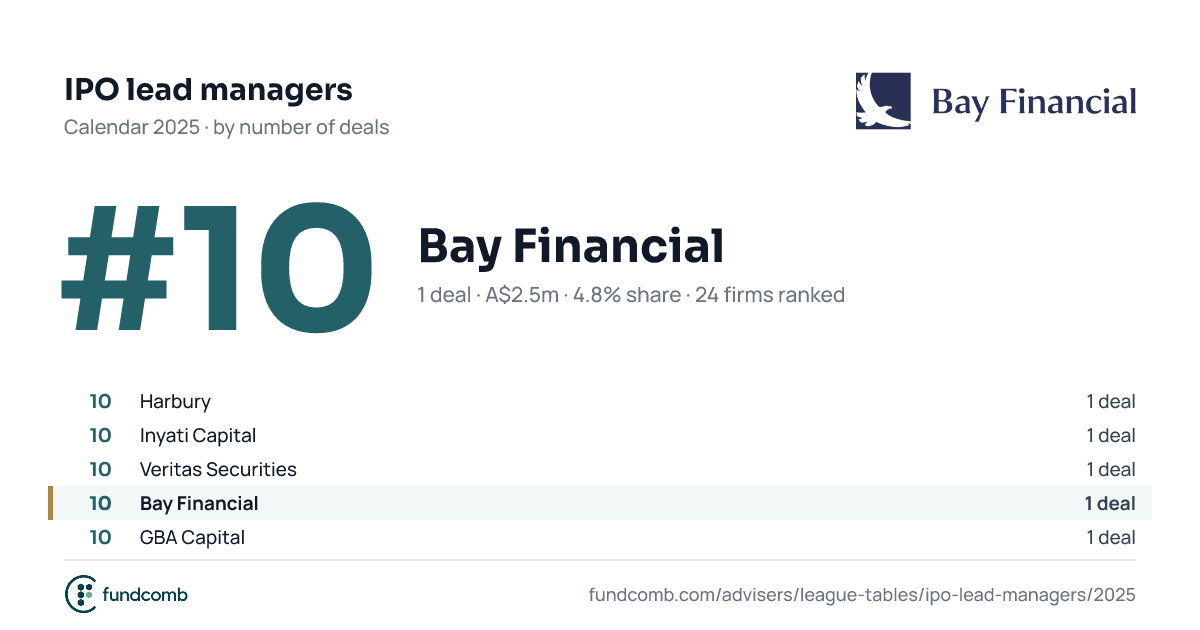
| 10 | Bay Financial A$2.5m · 4.8% share | 2.5 | 4.8% | |
| ||||
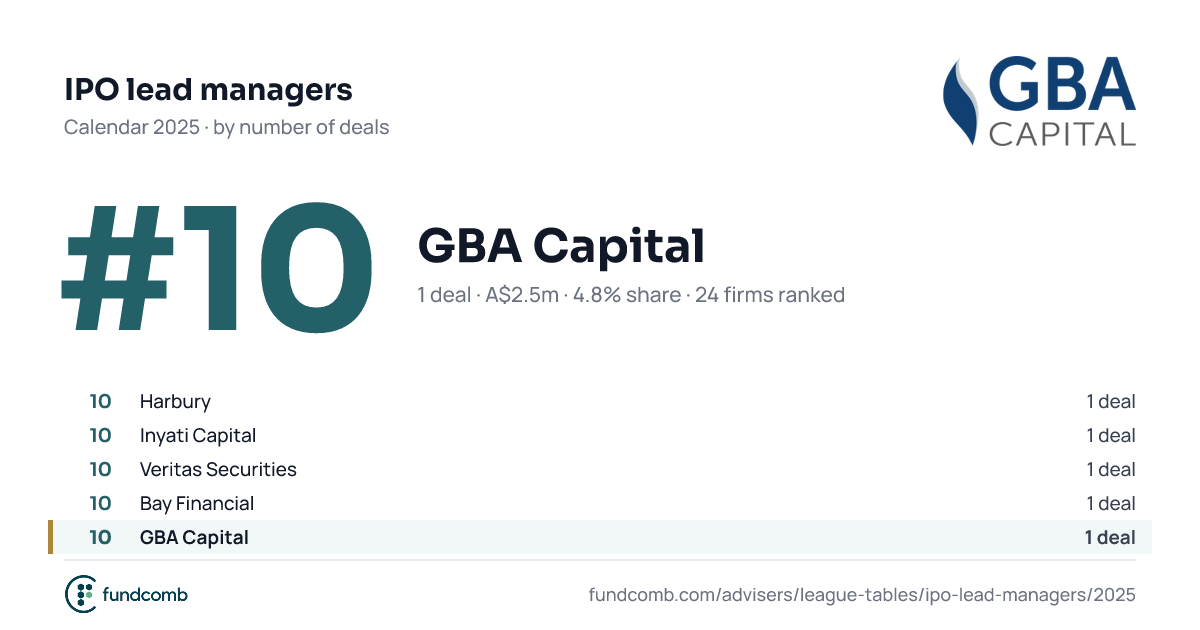
| 10 | GBA Capital A$2.5m · 4.8% share | 2.5 | 4.8% | |
| ||||
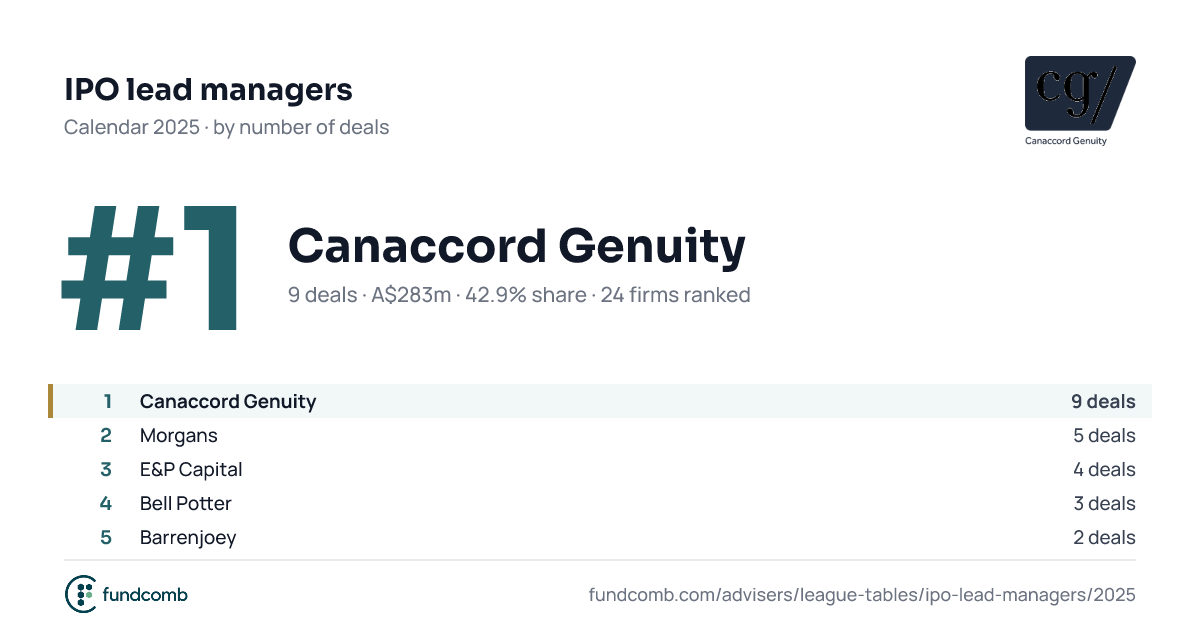
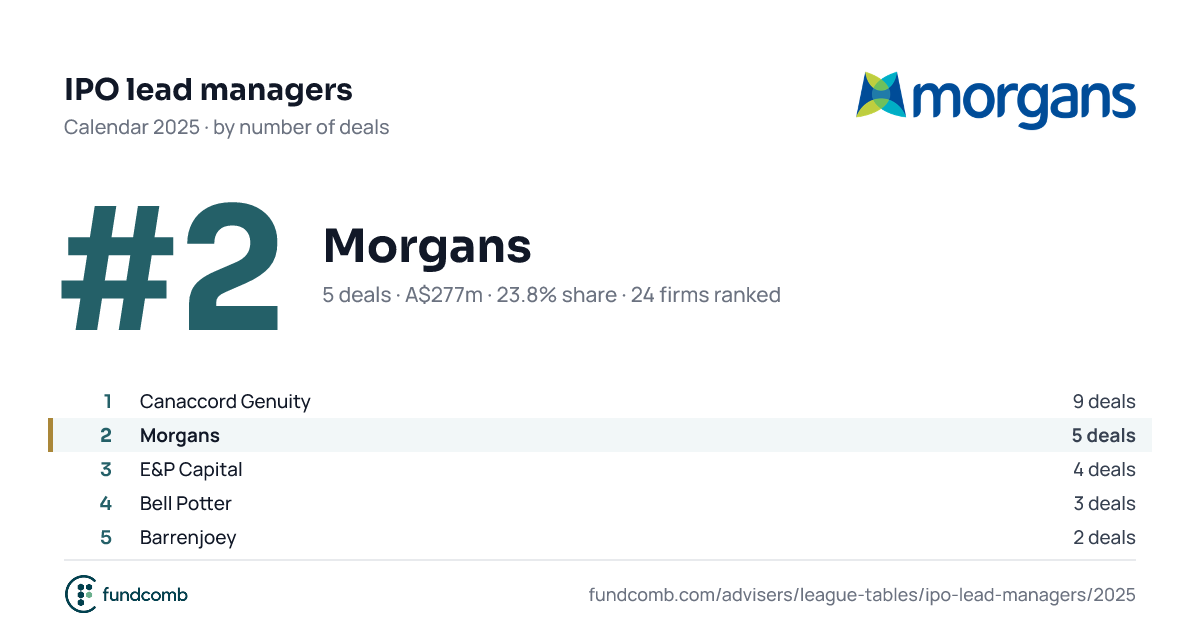
Top ten by number of deals.
This table's top firms in each year.
Value is shared equally among the lead managers on each deal. Methodology
Covers deals in Australia only for now. New Zealand is in progress; the United Kingdom, the United States, Canada, Singapore, China and India are planned. Values are in Australian dollars.