
Australian IPO lead managers
Calendar 2025 · ASX IPOs listed · 21 deals · A$2.5bn disclosed
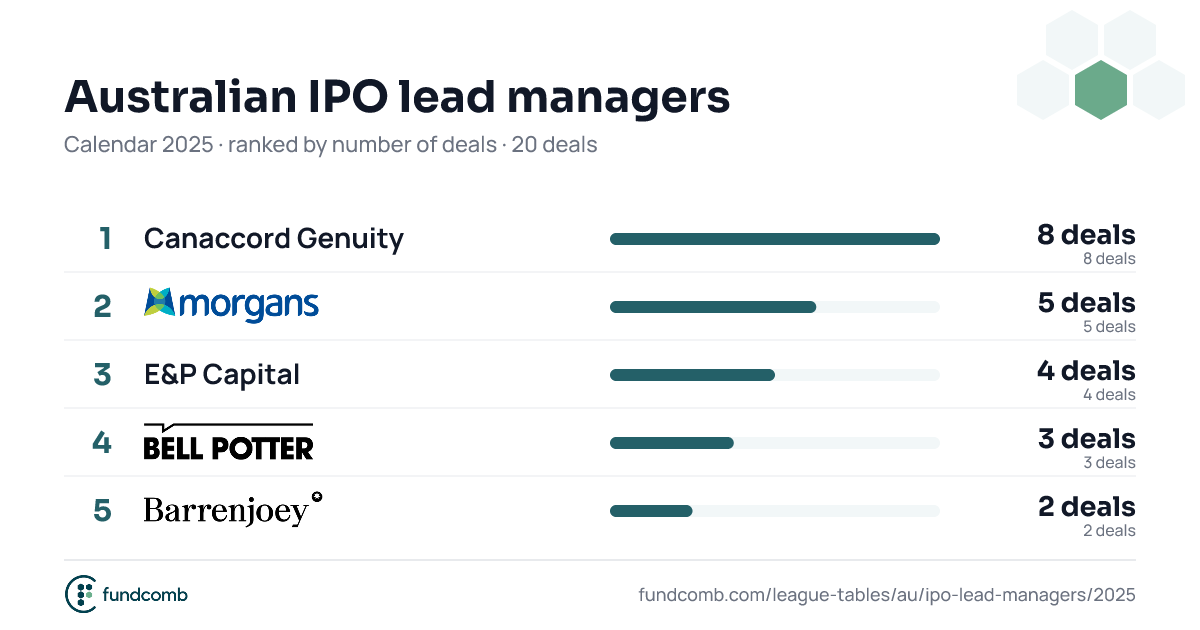
| 1 | Canaccord Genuity A$283m · 42.9% share | 282.5 | 42.9% | |
| ||||
| 2 | Morgans A$277m · 23.8% share | 276.9 | 23.8% | |
| ||||
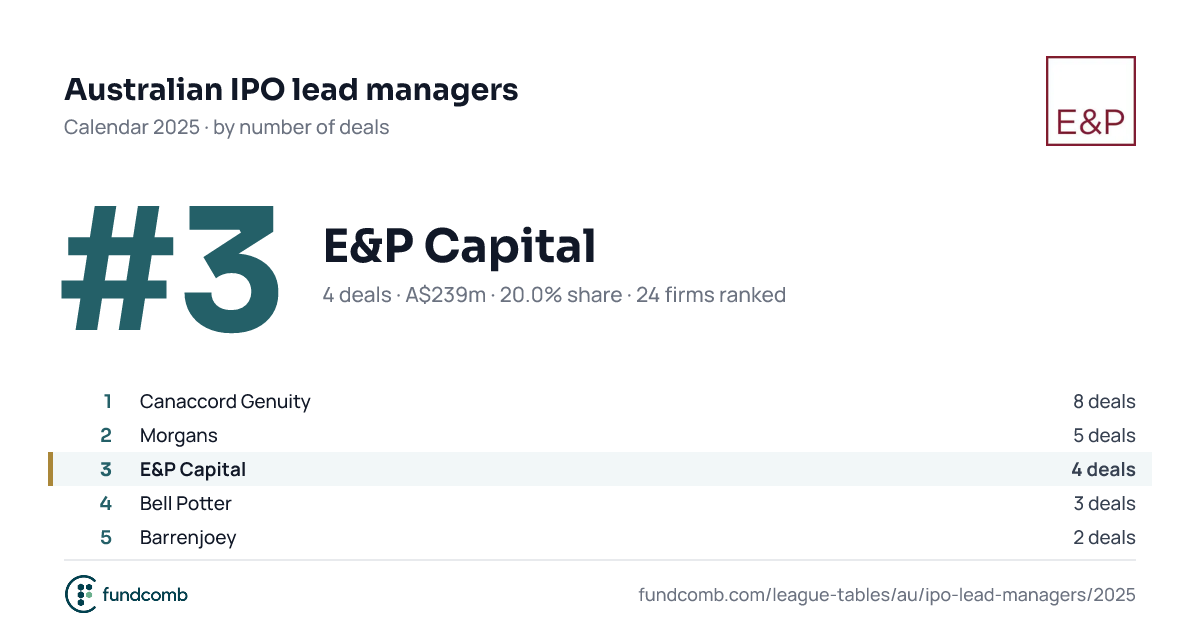
| 3 | E&P Capital A$239m · 19.0% share | 239.4 | 19.0% | |
| ||||
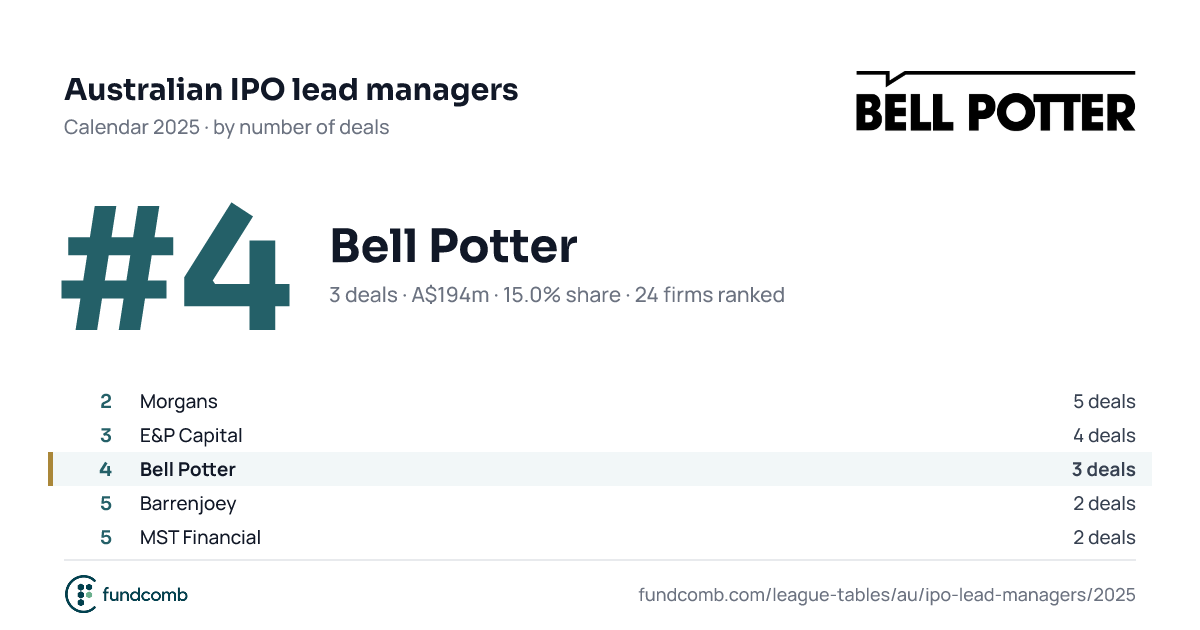
| 4 | Bell Potter A$194m · 14.3% share | 194.4 | 14.3% | |
| ||||
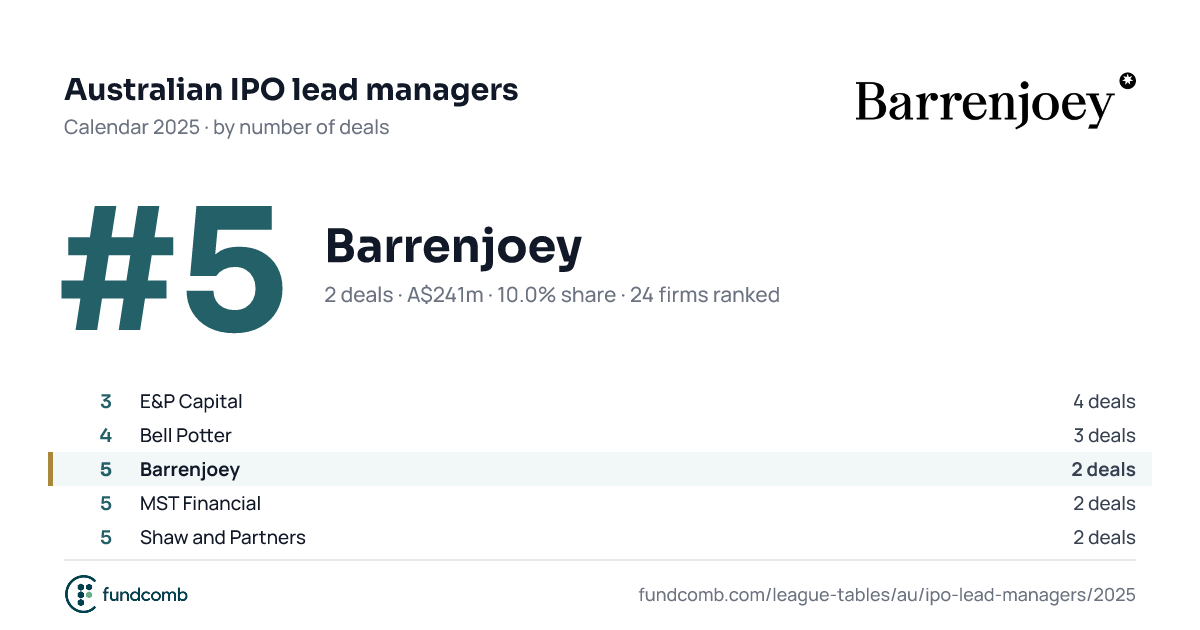
| 5 | Barrenjoey A$241m · 9.5% share | 240.8 | 9.5% | |
| ||||
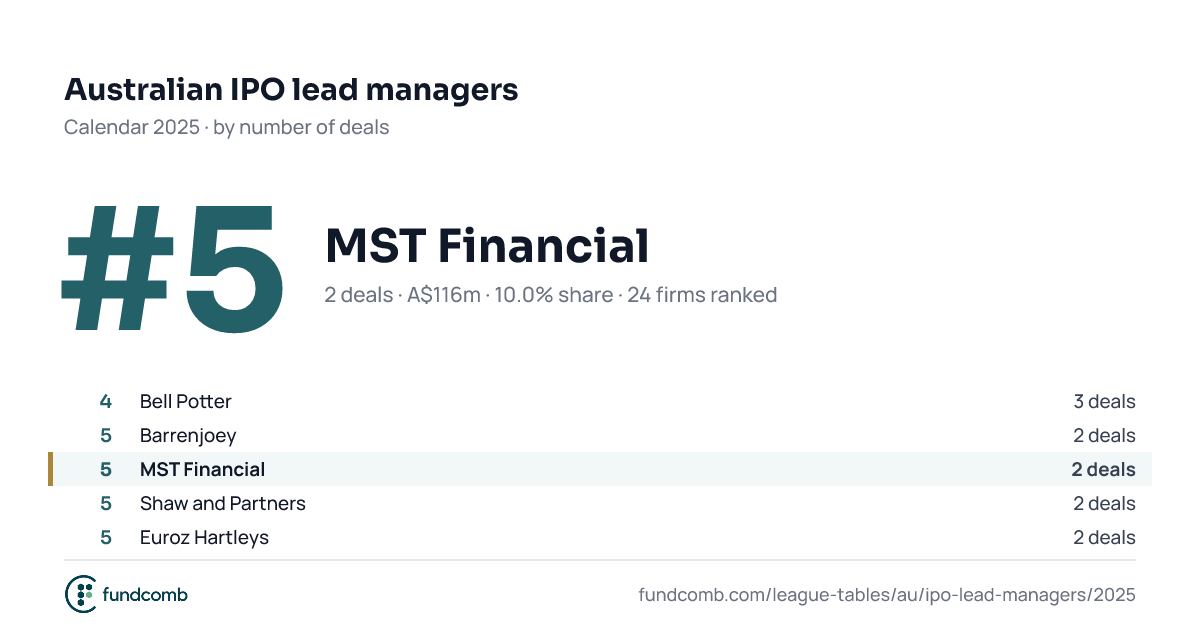
| 5 | MST Financial A$116m · 9.5% share | 116.0 | 9.5% | |
| ||||
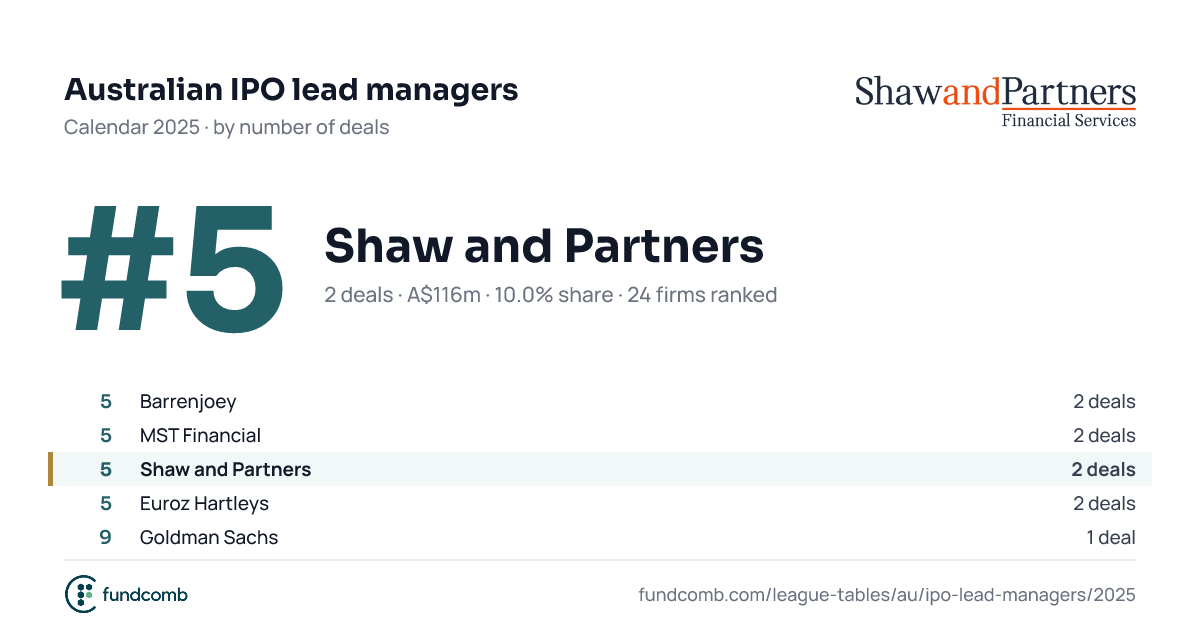
| 5 | Shaw and Partners A$116m · 9.5% share | 116.0 | 9.5% | |
| ||||
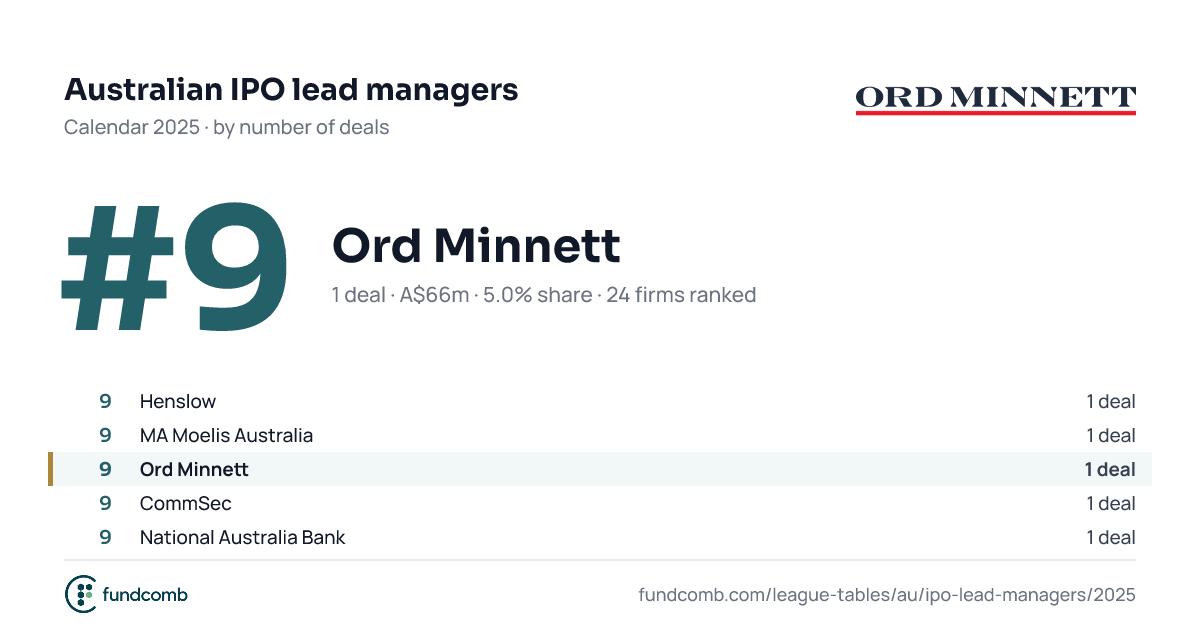
| 5 | Ord Minnett A$86m · 9.5% share | 86.0 | 9.5% | |
| ||||
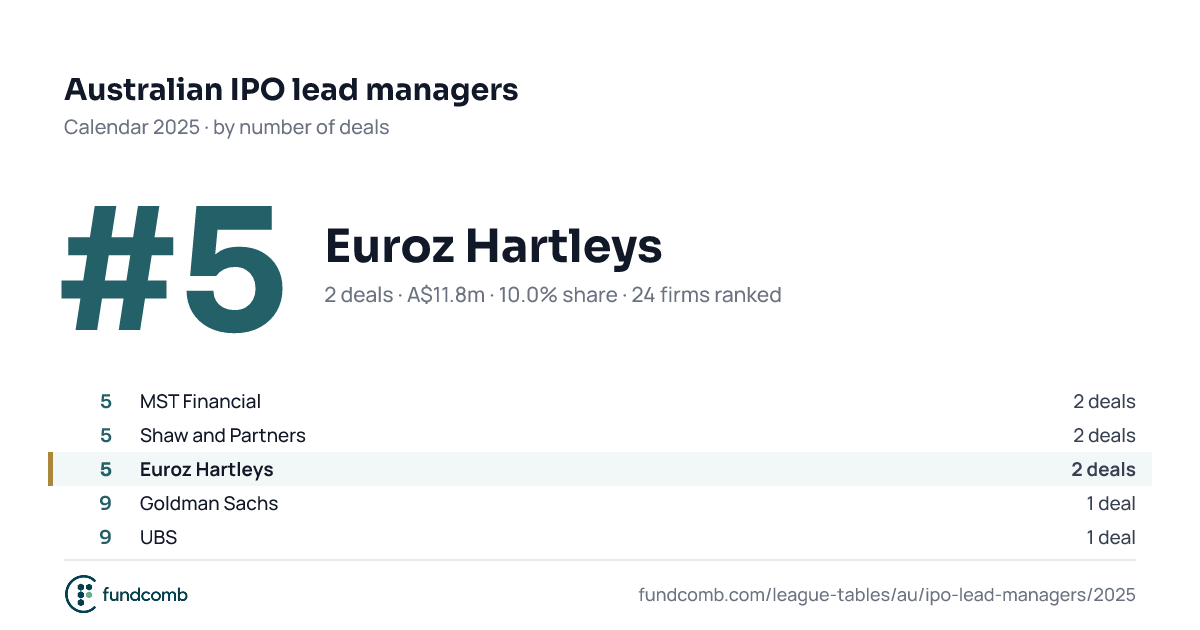
| 5 | Euroz Hartleys A$11.8m · 9.5% share | 11.8 | 9.5% | |
| ||||
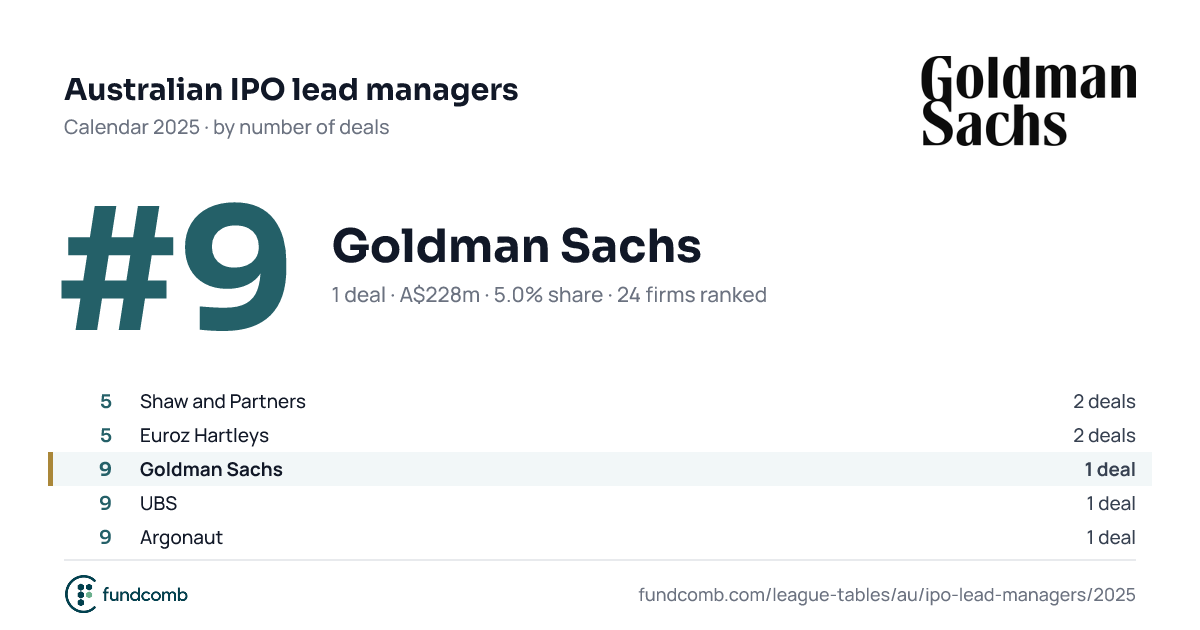
| 10 | Goldman Sachs A$228m · 4.8% share | 228.3 | 4.8% | |
| ||||
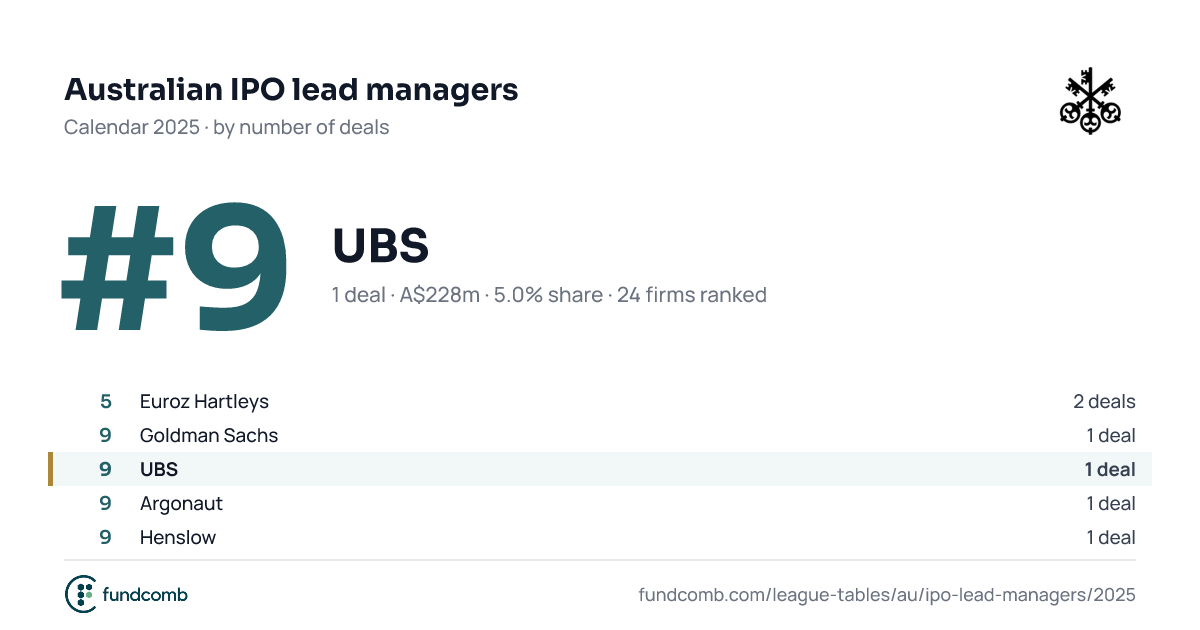
| 10 | UBS A$228m · 4.8% share | 228.3 | 4.8% | |
| ||||
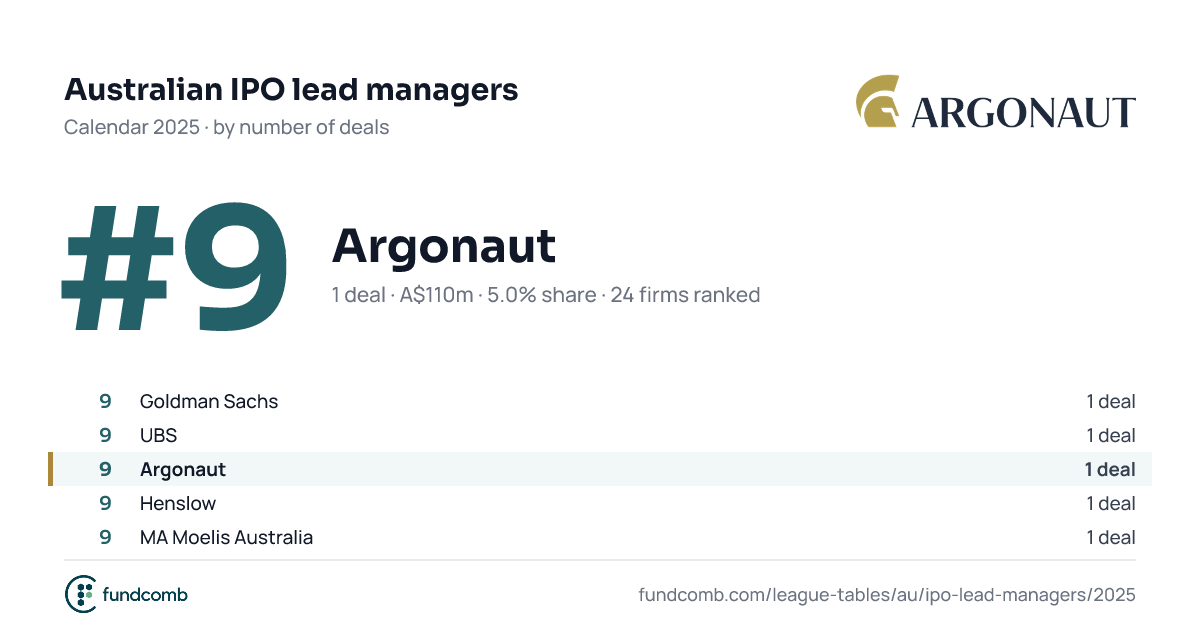
| 10 | Argonaut A$110m · 4.8% share | 110.0 | 4.8% | |
| ||||
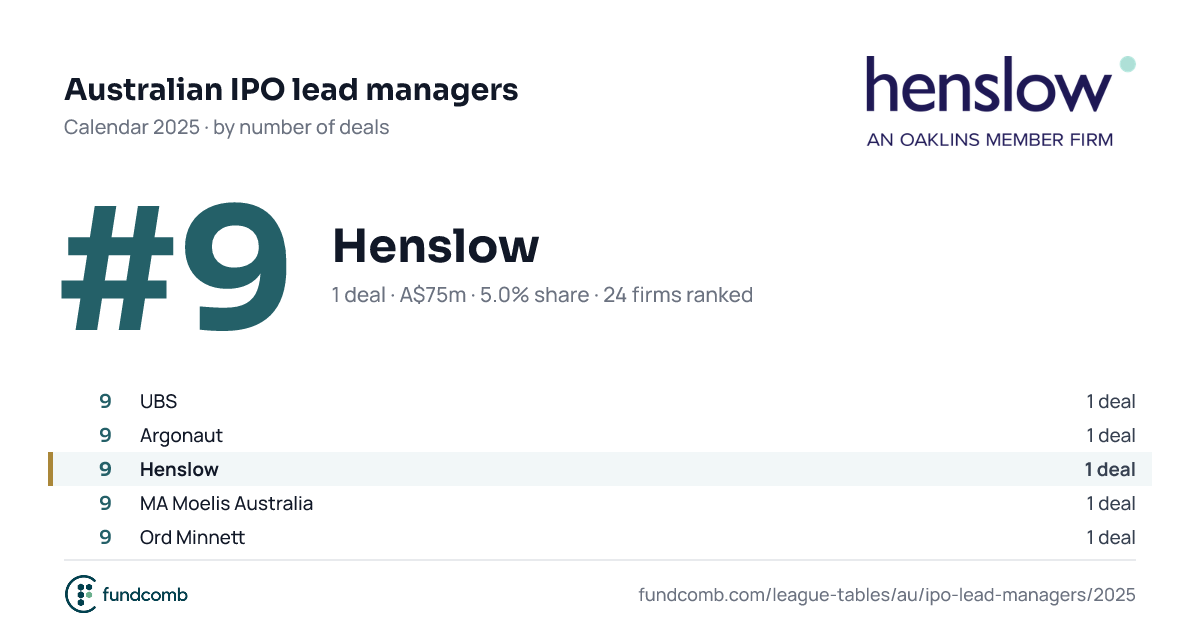
| 10 | Henslow A$75m · 4.8% share | 75.0 | 4.8% | |
| ||||
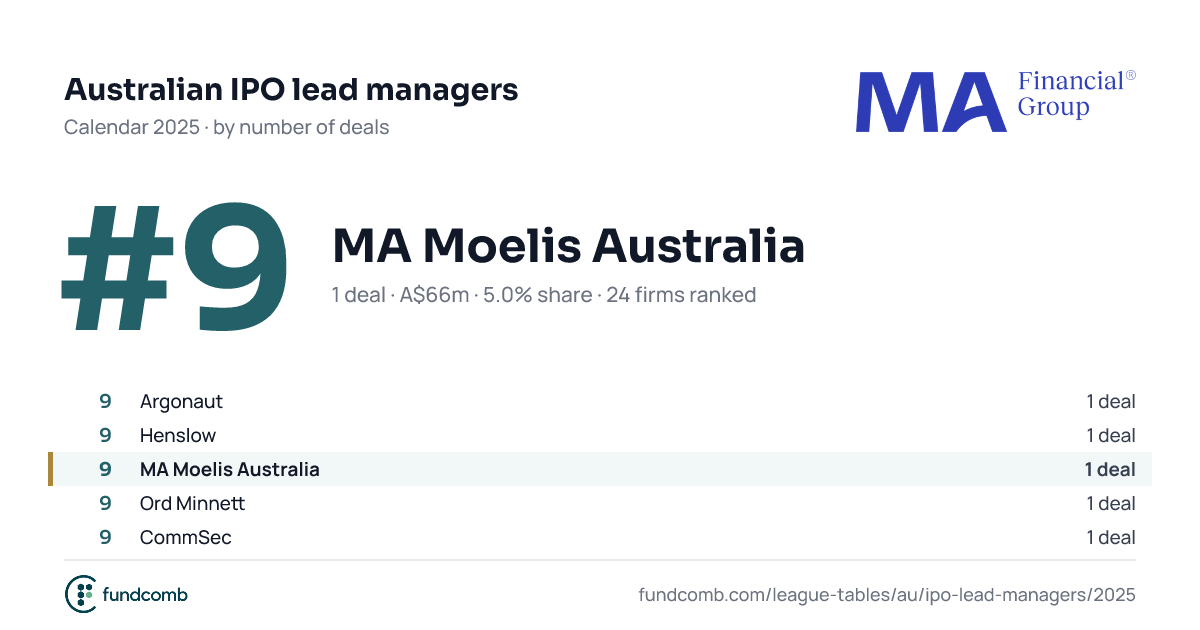
| 10 | MA Moelis Australia A$66m · 4.8% share | 66.0 | 4.8% | |
| ||||
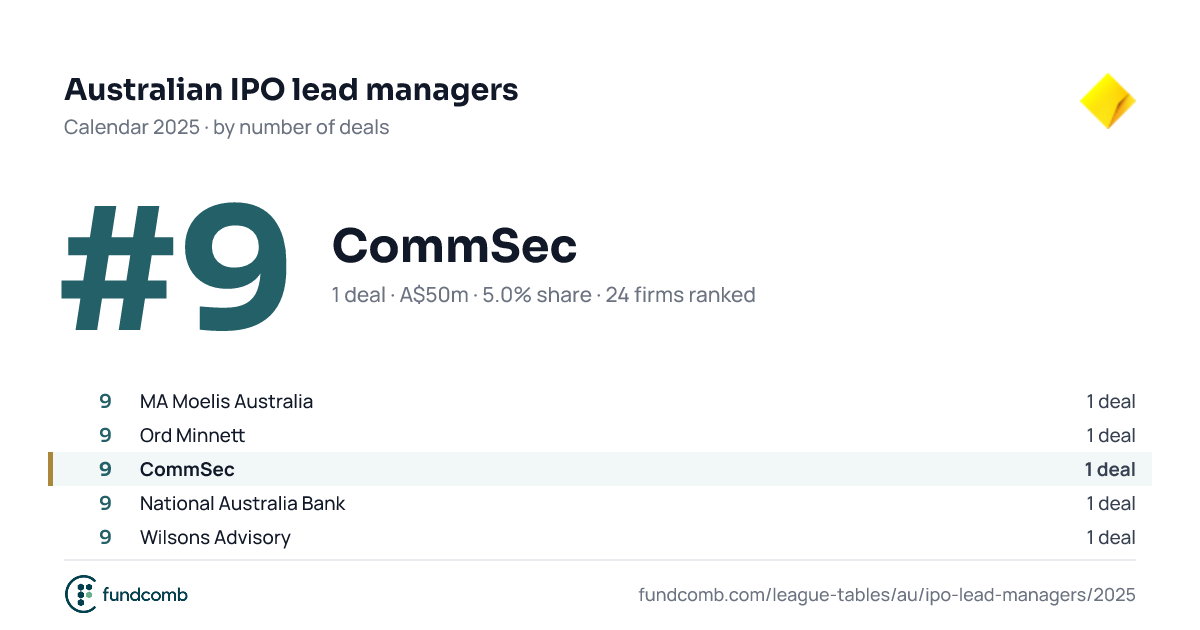
| 10 | CommSec A$50m · 4.8% share | 50.0 | 4.8% | |
| ||||
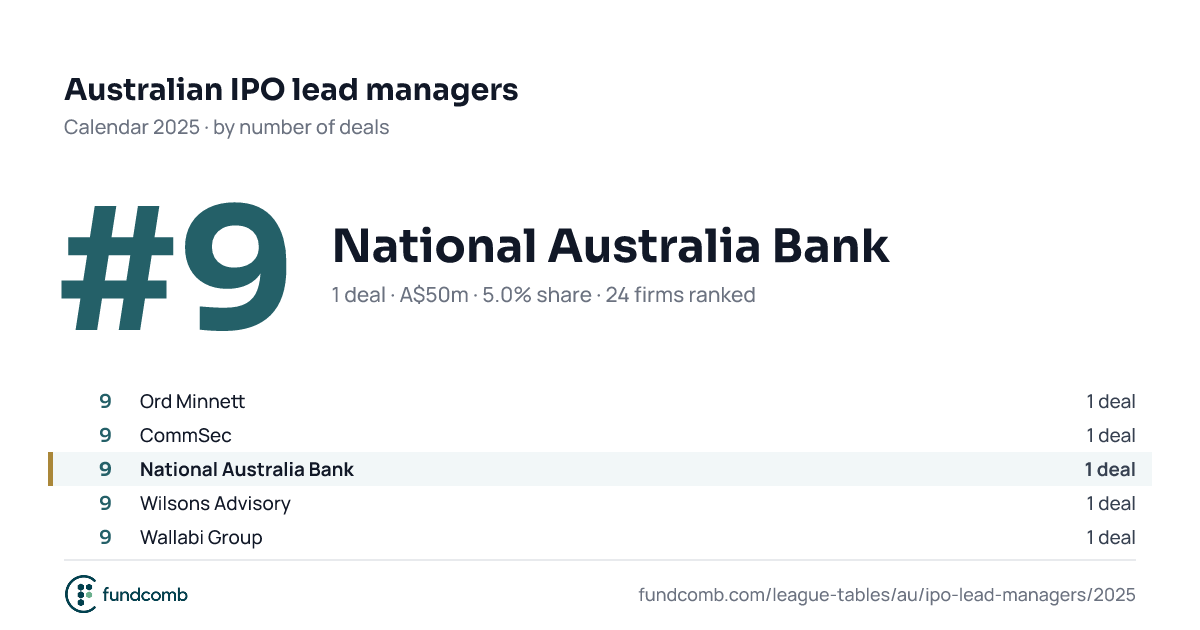
| 10 | National Australia Bank A$50m · 4.8% share | 50.0 | 4.8% | |
| ||||
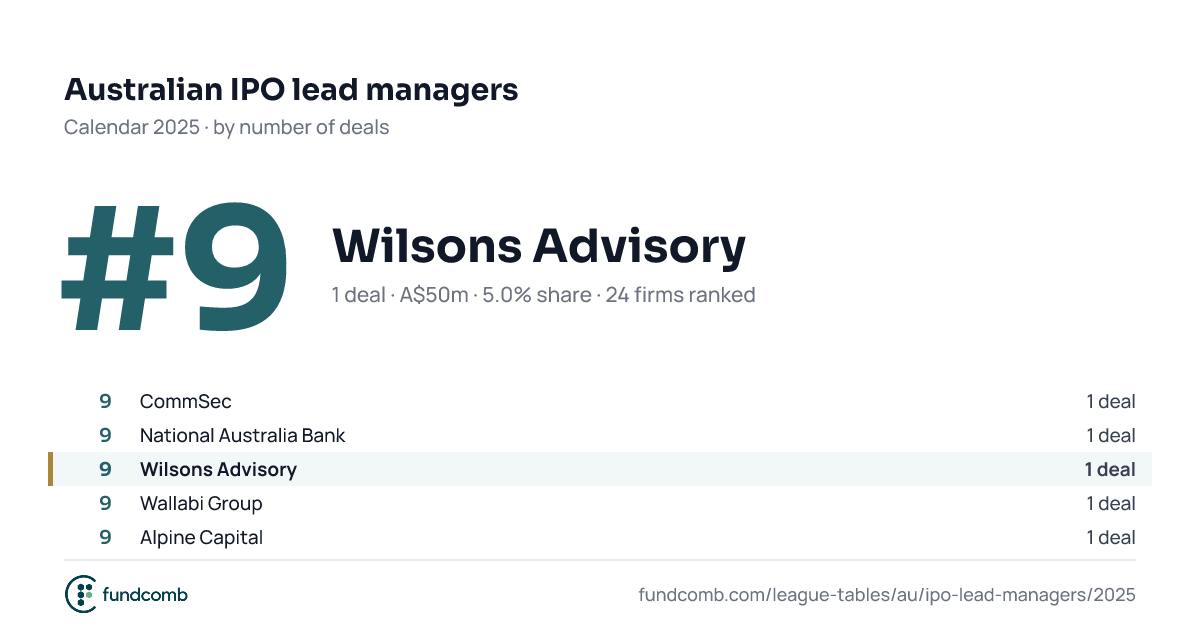
| 10 | Wilsons Advisory A$50m · 4.8% share | 50.0 | 4.8% | |
| ||||
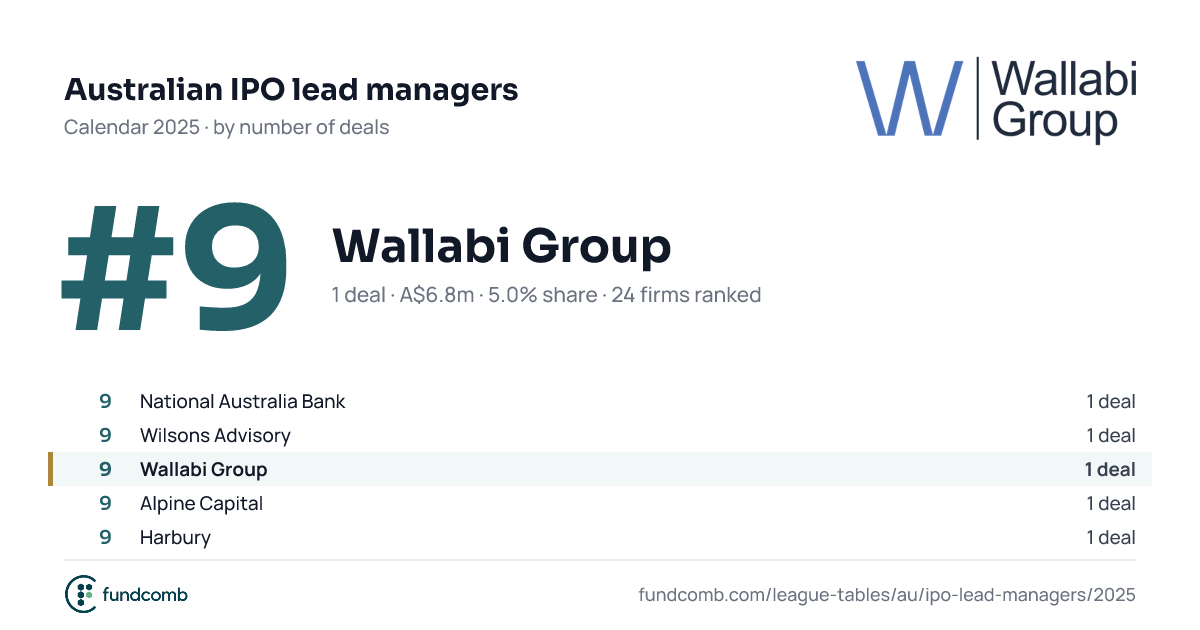
| 10 | Wallabi Group A$6.8m · 4.8% share | 6.8 | 4.8% | |
| ||||
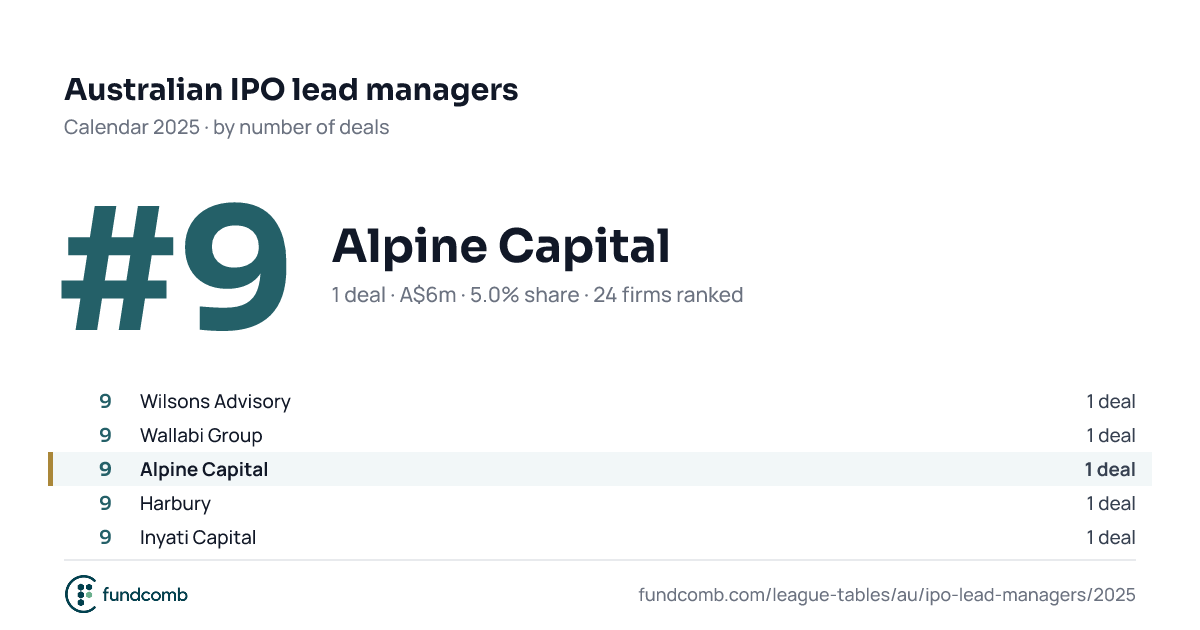
| 10 | Alpine Capital A$6m · 4.8% share | 6.0 | 4.8% | |
| ||||
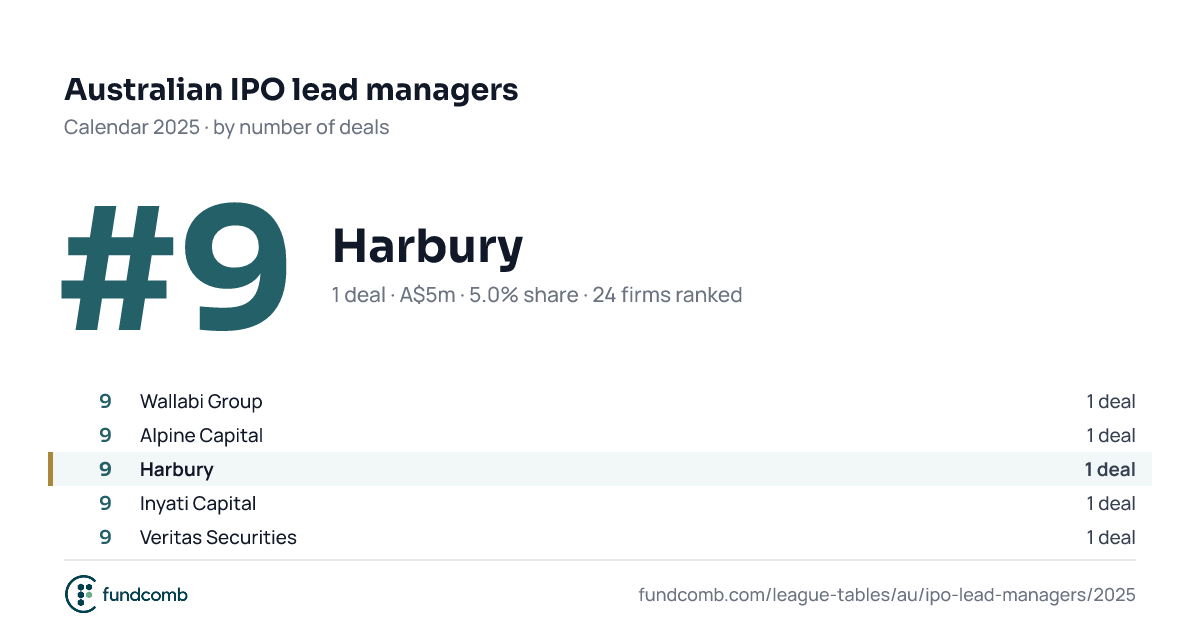
| 10 | Harbury A$5m · 4.8% share | 5.0 | 4.8% | |
| ||||
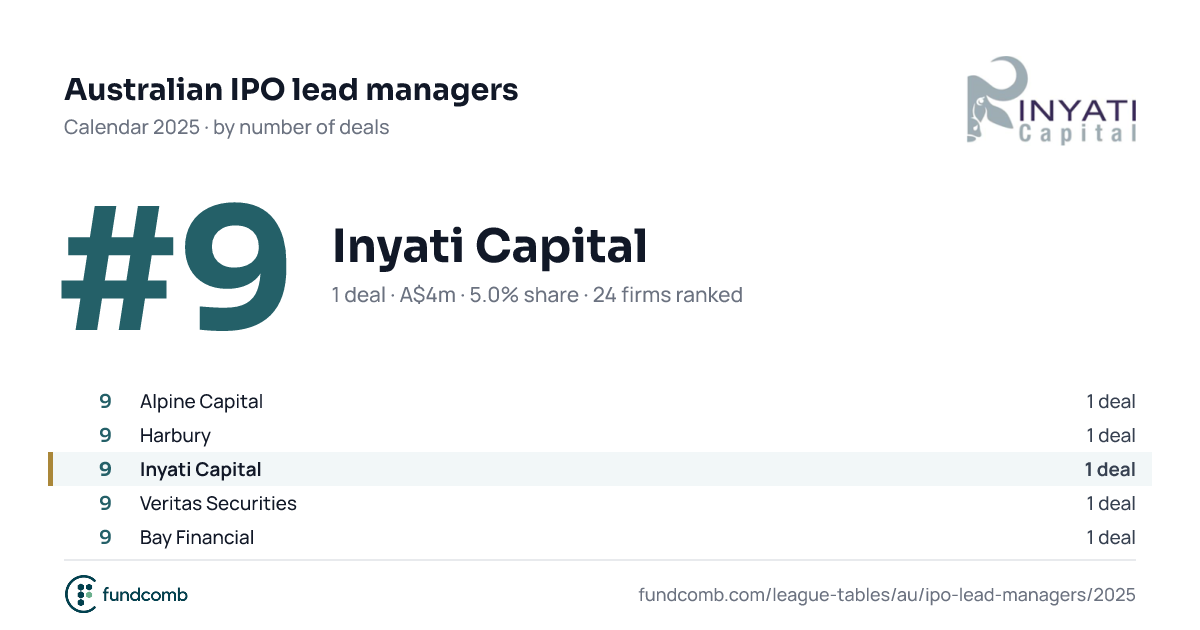
| 10 | Inyati Capital A$4m · 4.8% share | 4.0 | 4.8% | |
| ||||
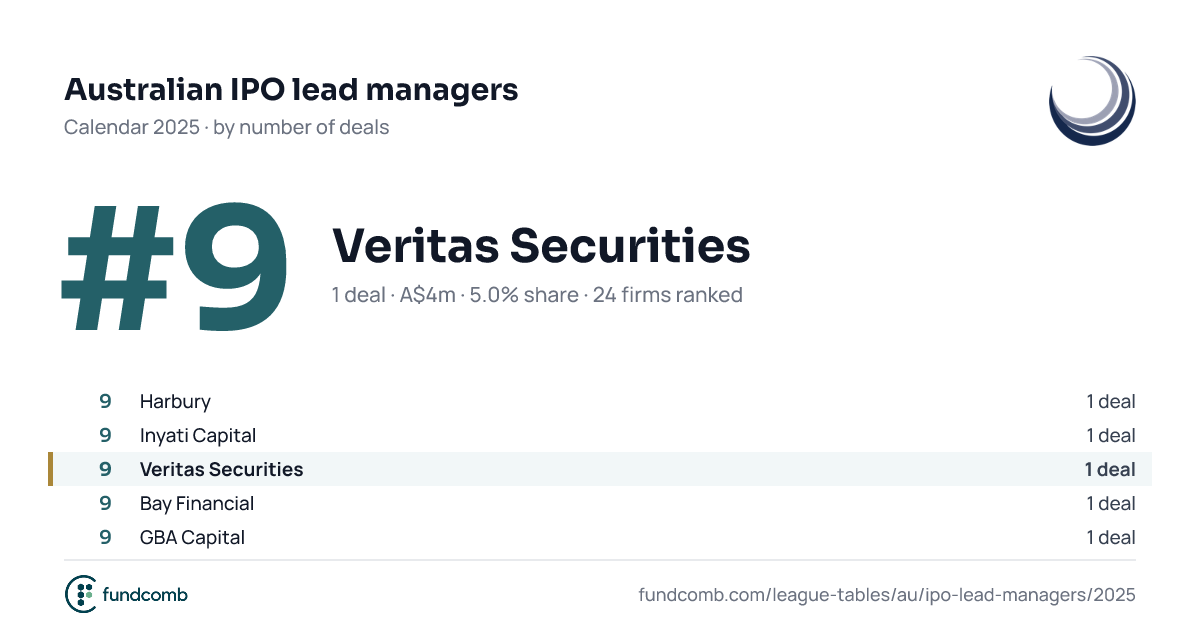
| 10 | Veritas Securities A$4m · 4.8% share | 4.0 | 4.8% | |
| ||||
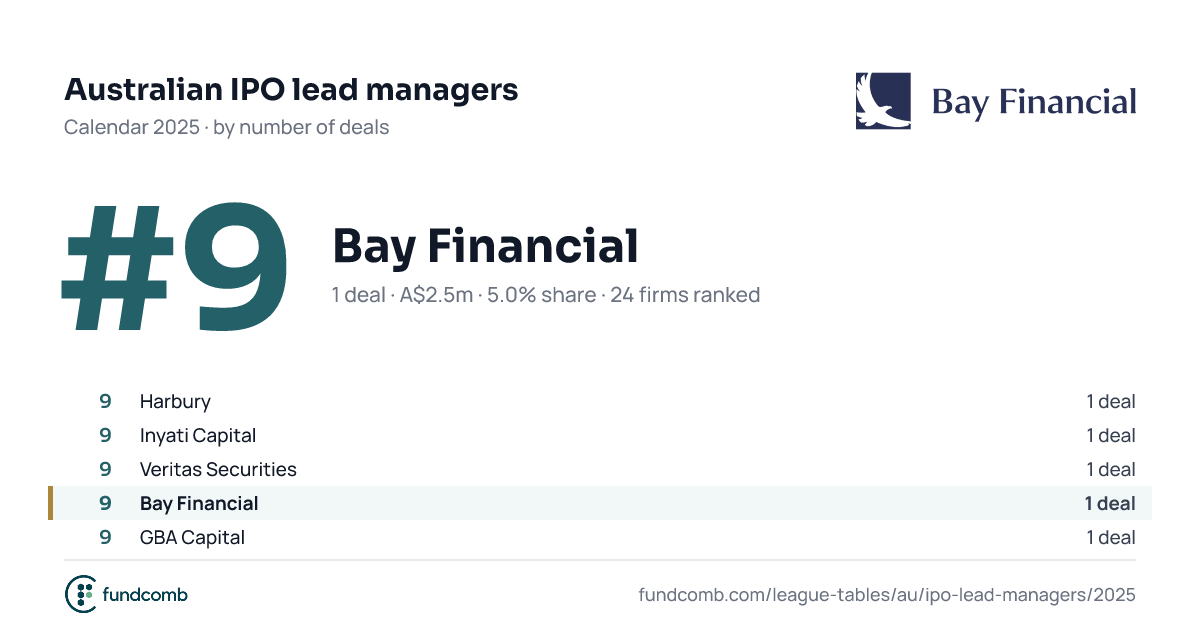
| 10 | Bay Financial A$2.5m · 4.8% share | 2.5 | 4.8% | |
| ||||
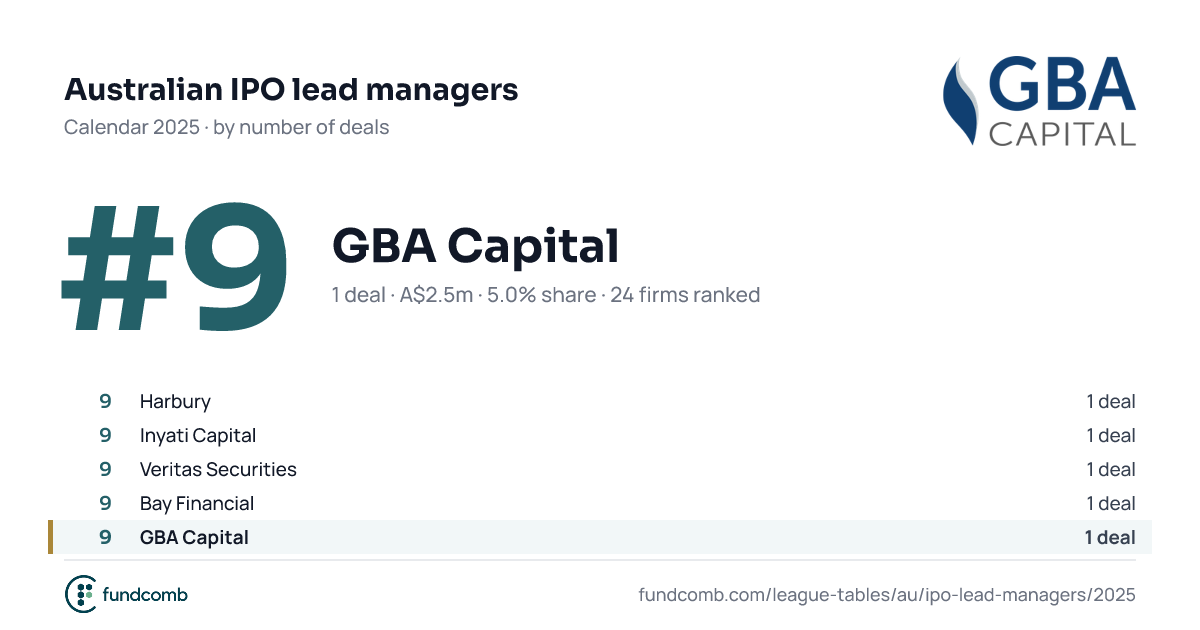
| 10 | GBA Capital A$2.5m · 4.8% share | 2.5 | 4.8% | |
| ||||
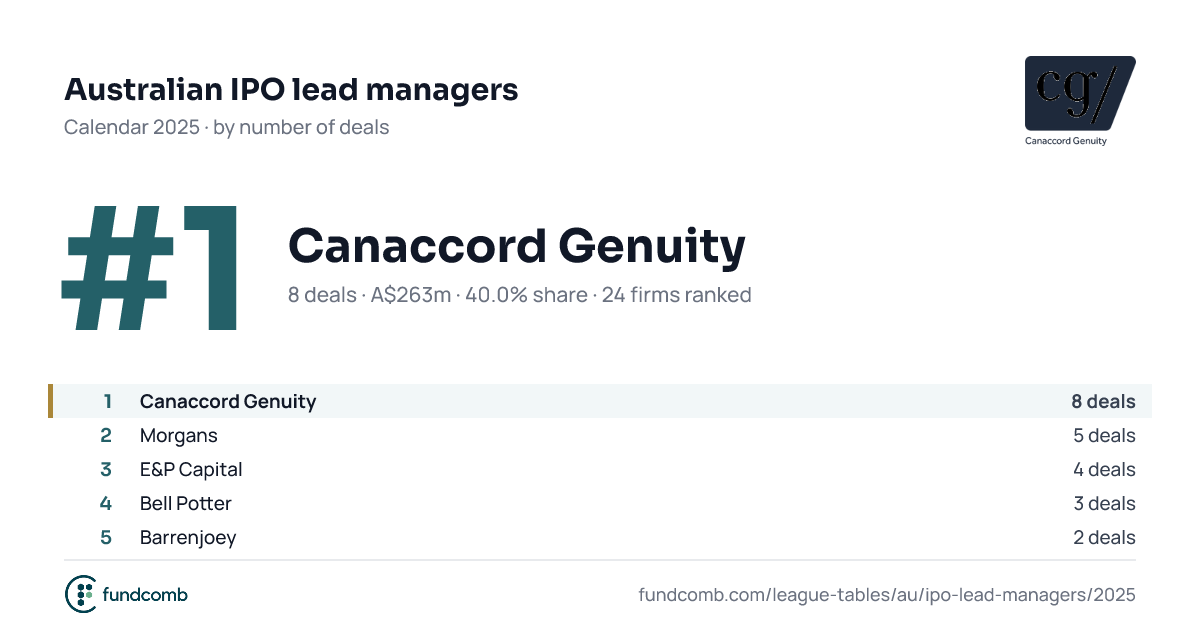
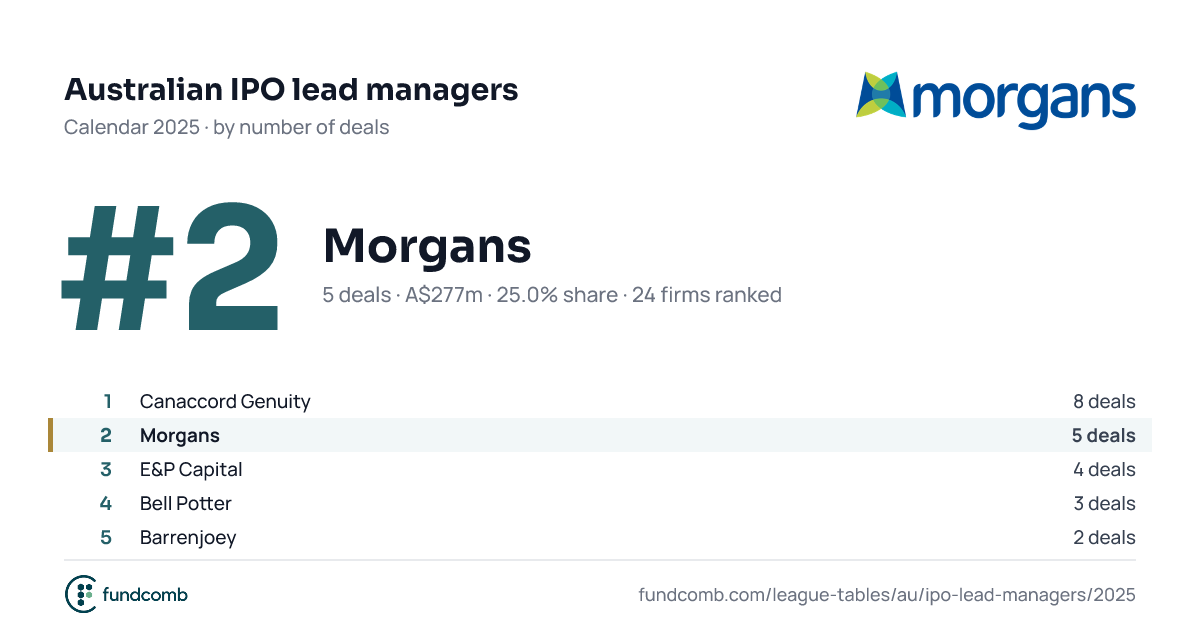
Top ten by number of deals.
This table's top firms in each year.
Value is shared equally among the lead managers on each deal. Methodology