
Australian M&A financial advisers: completed deals
H2 2026 to date · Australian M&A completed to 9 Nov 2026 · 39 deals · A$19bn disclosed
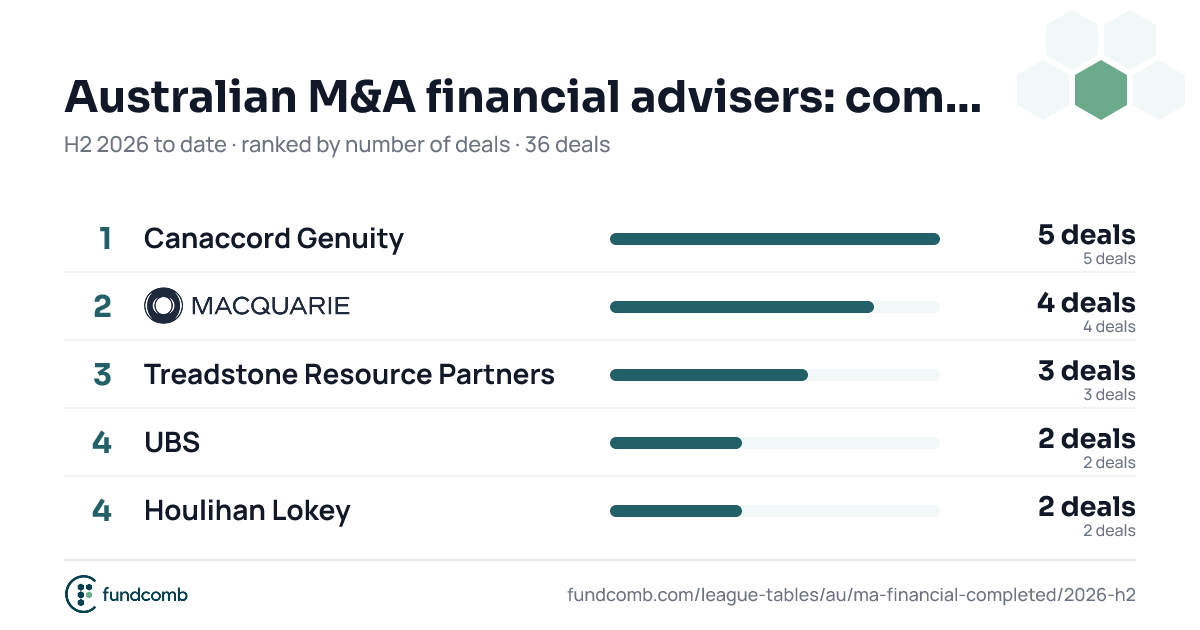
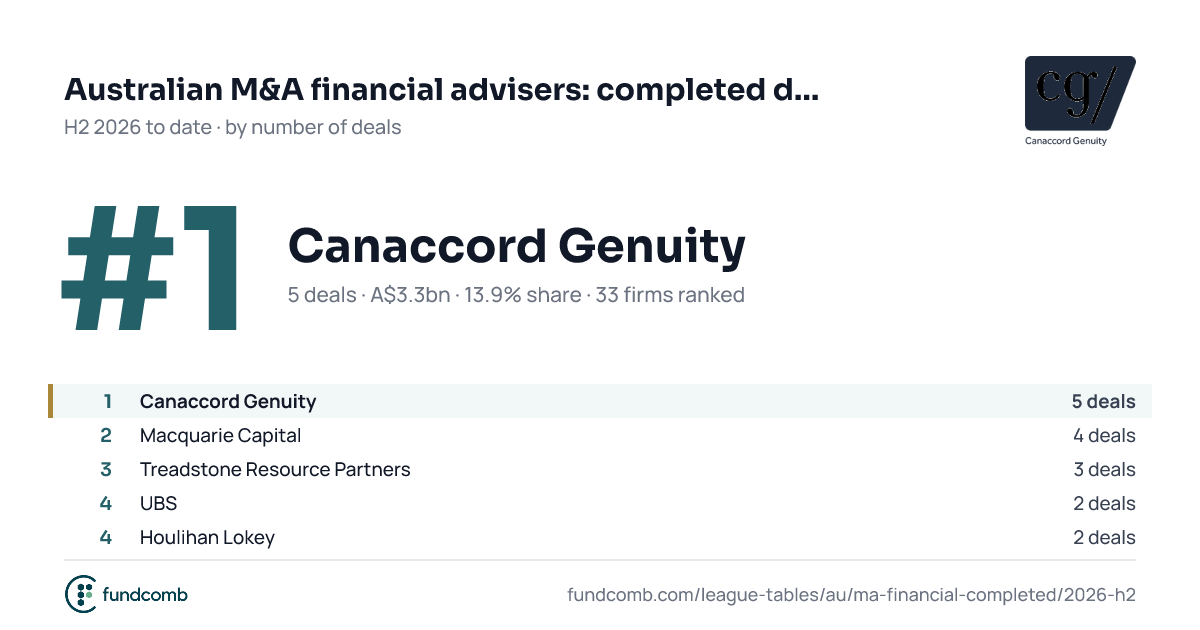
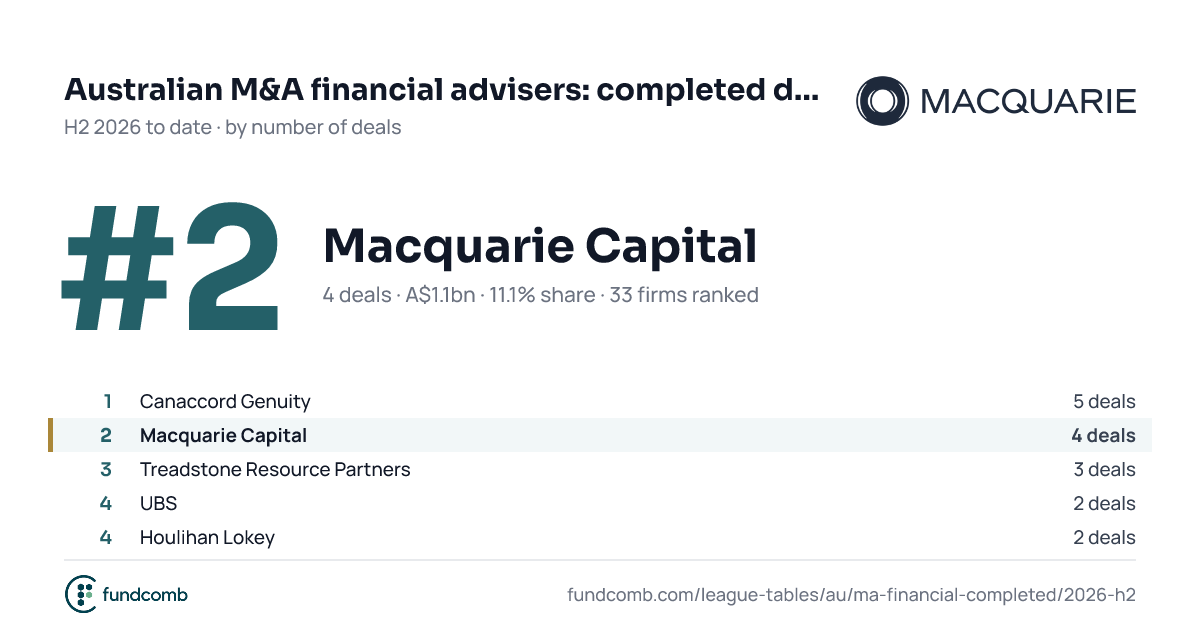
| 1 | Canaccord Genuity A$3.3bn · 12.8% share · new | 3,324.8 | 12.8% | New | |
| |||||
| 2 | Macquarie Capital A$1.1bn · 10.3% share · was #1 | 1,091.2 | 10.3% | 1 , down 1 places | |
| |||||
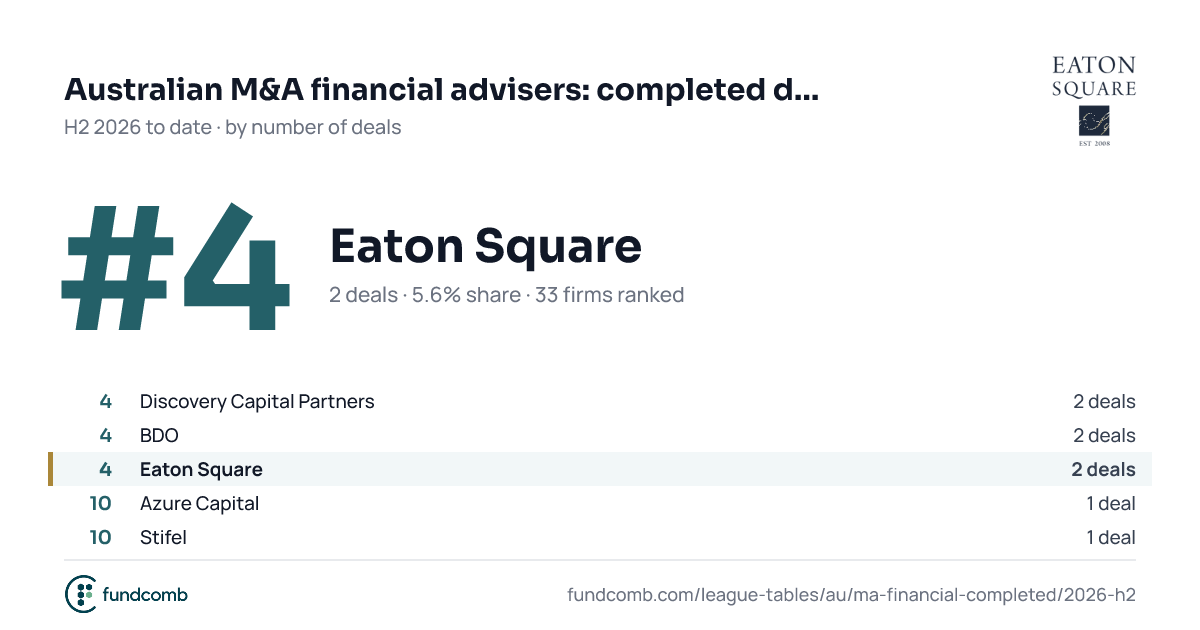
| 2 | Eaton Square 10.3% share · new | – | 10.3% | New | |
| |||||
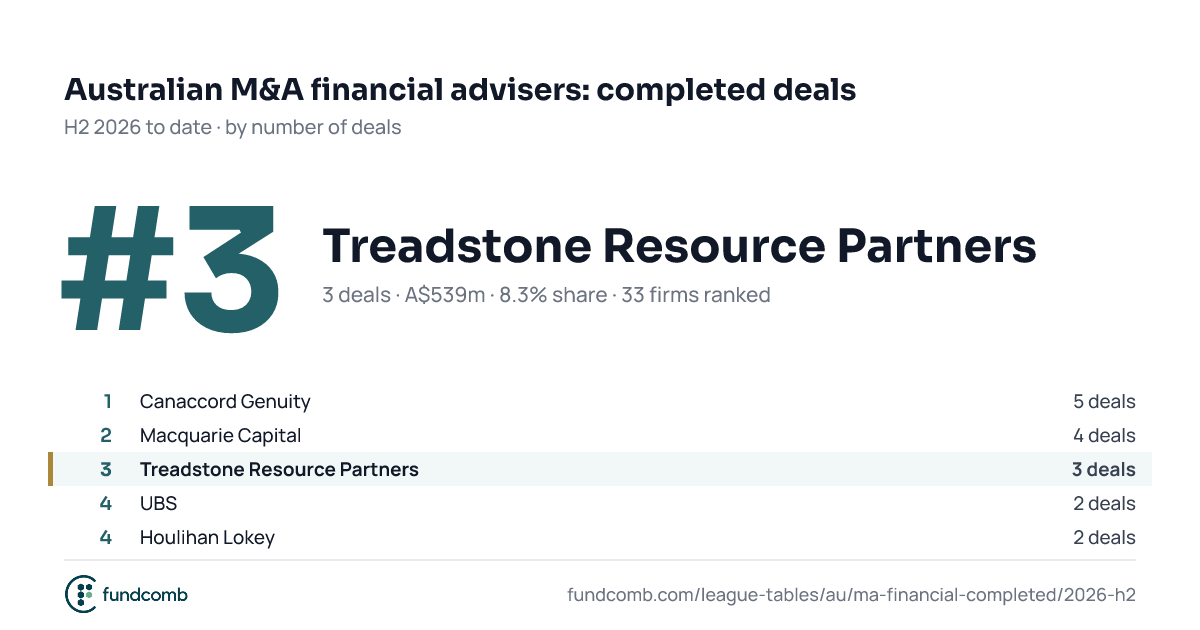
| 4 | Treadstone Resource Partners A$539m · 7.7% share · new | 539.0 | 7.7% | New | |
| |||||
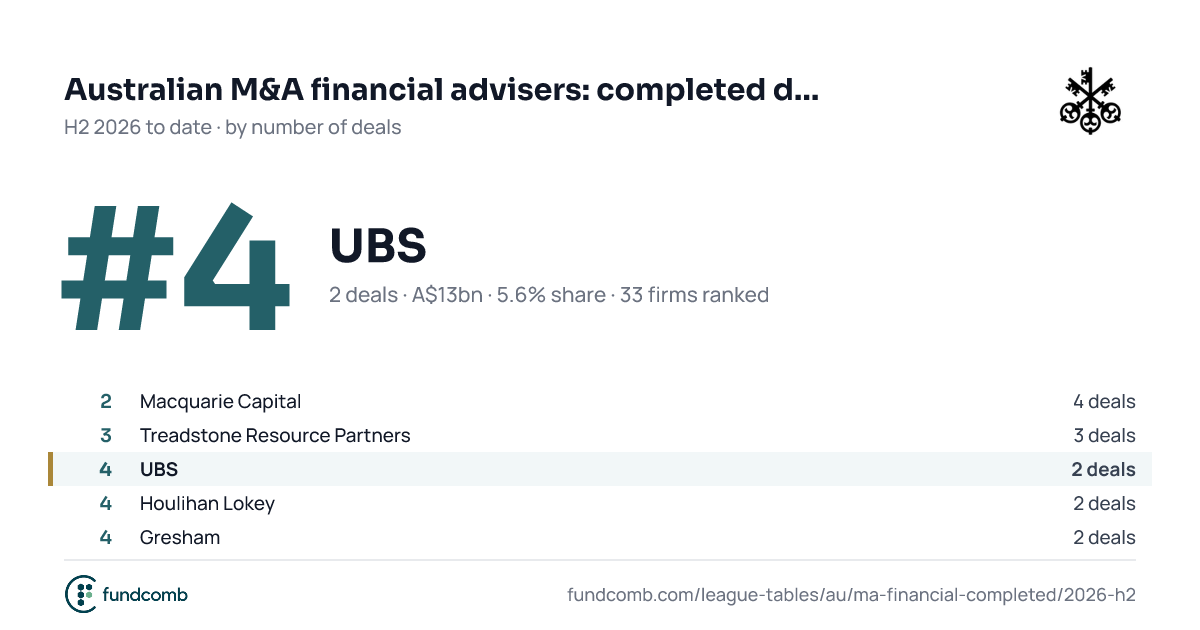
| 5 | UBS A$13bn · 5.1% share · was #8 | 12,800.0 | 5.1% | 8 , up 3 places | |
| |||||
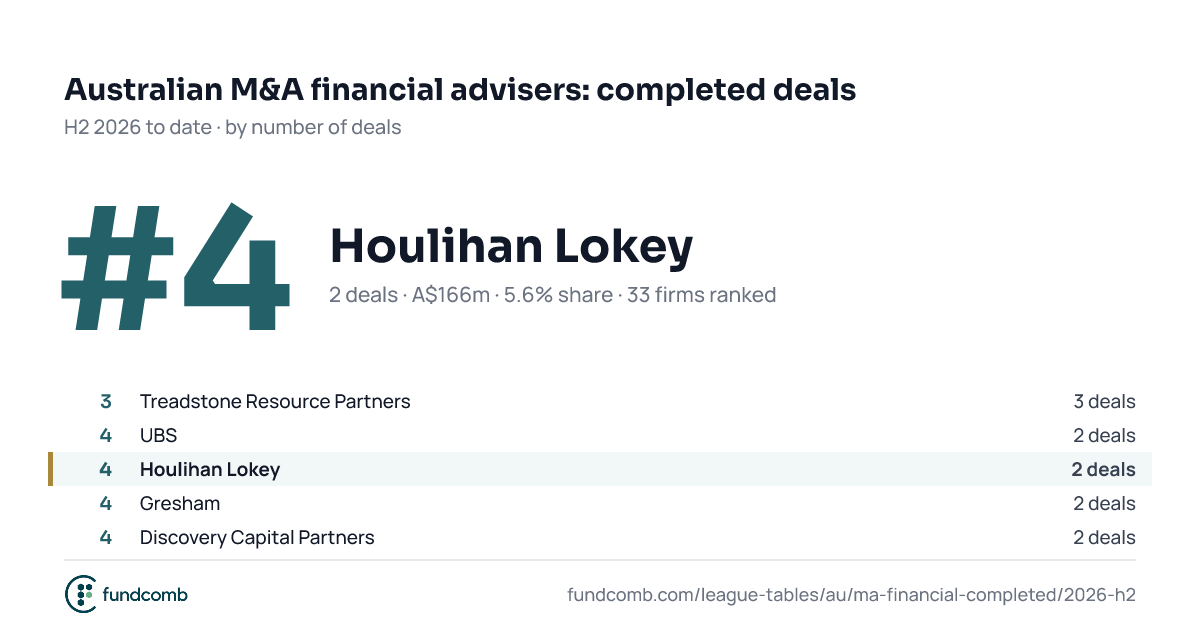
| 5 | Houlihan Lokey A$166m · 5.1% share · new | 166.4 | 5.1% | New | |
| |||||
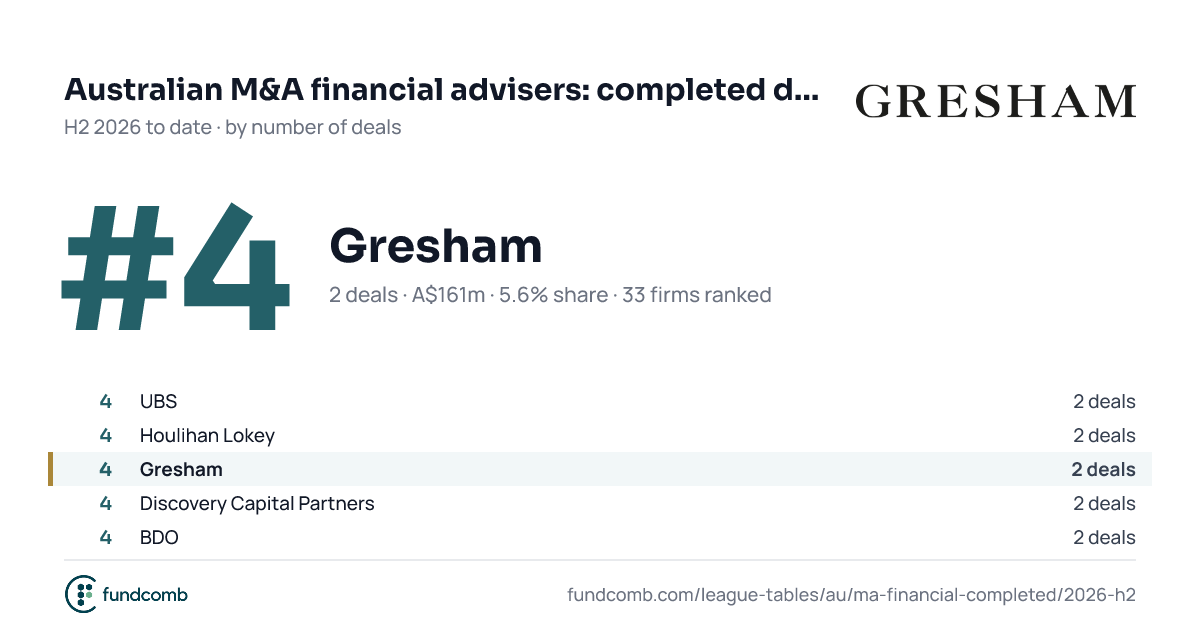
| 5 | Gresham A$161m · 5.1% share · was #3 | 161.0 | 5.1% | 3 , down 2 places | |
| |||||
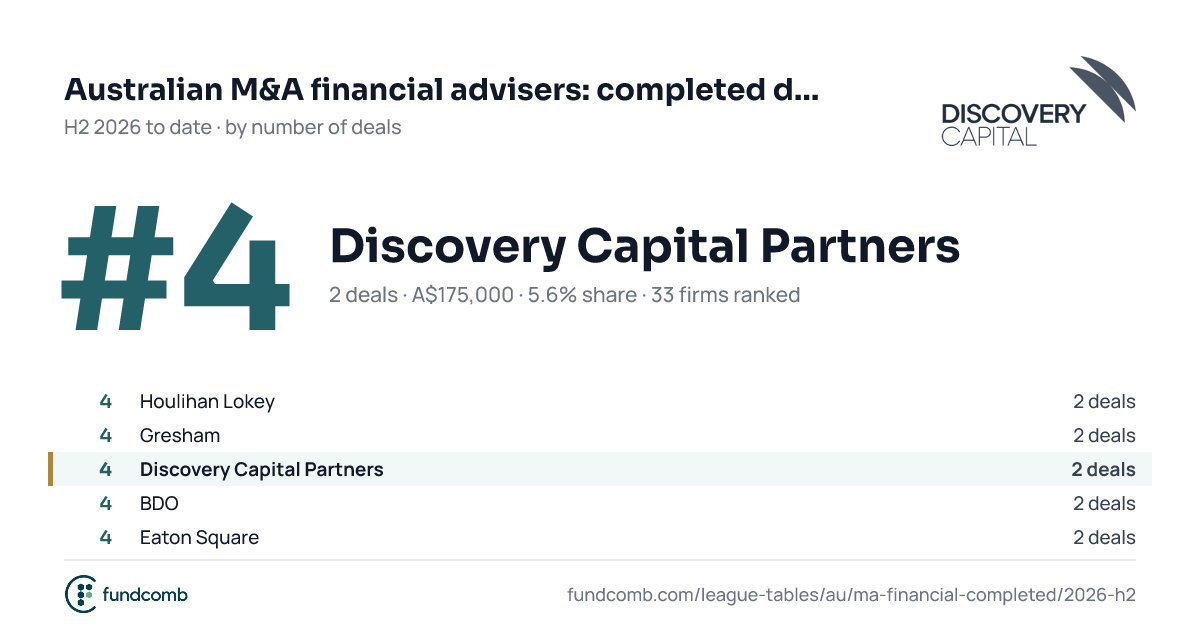
| 5 | Discovery Capital Partners A$175,000 · 5.1% share · new | 0.2 | 5.1% | New | |
| |||||
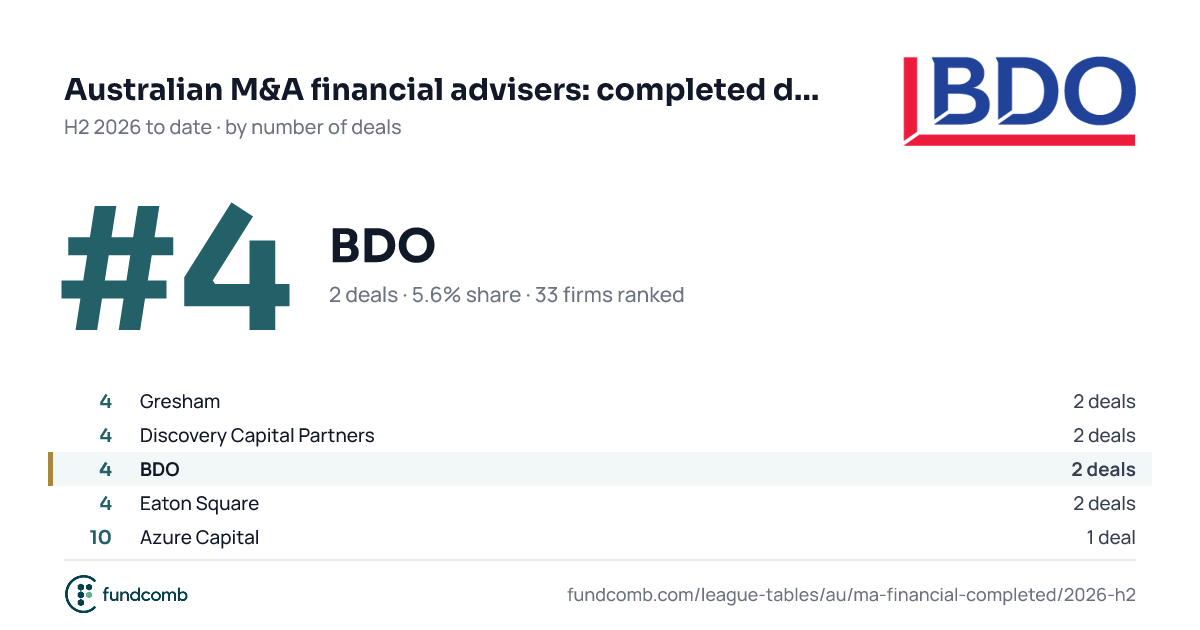
| 5 | BDO 5.1% share · new | – | 5.1% | New | |
| |||||
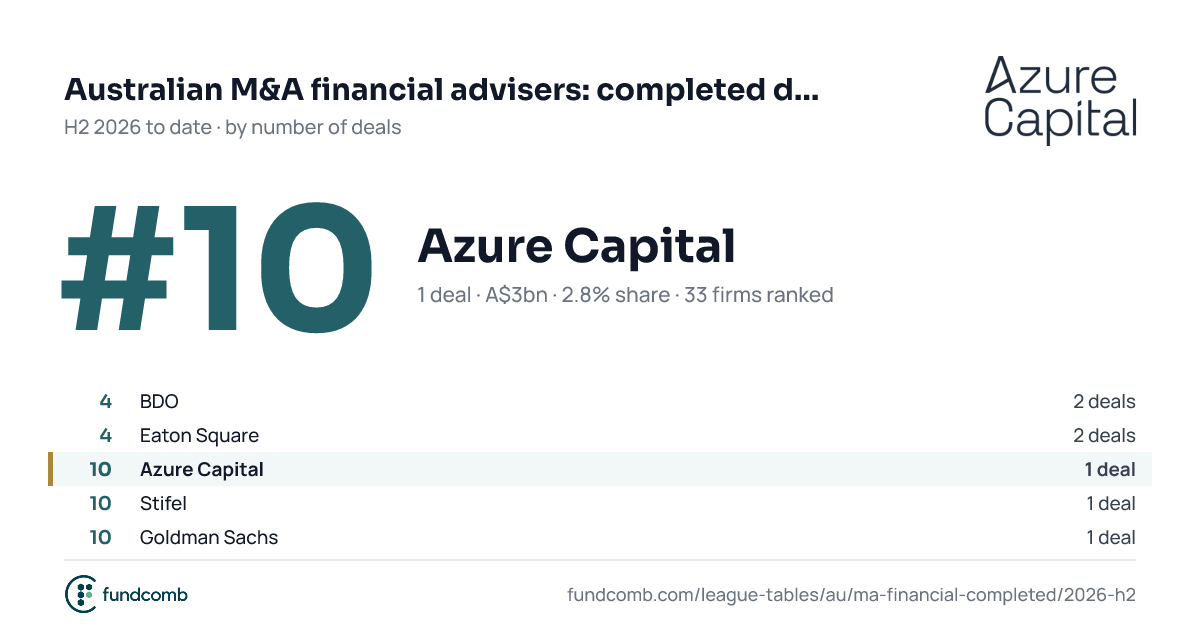
| 10 | Azure Capital A$3bn · 2.6% share · new | 3,000.0 | 2.6% | New | |
| |||||
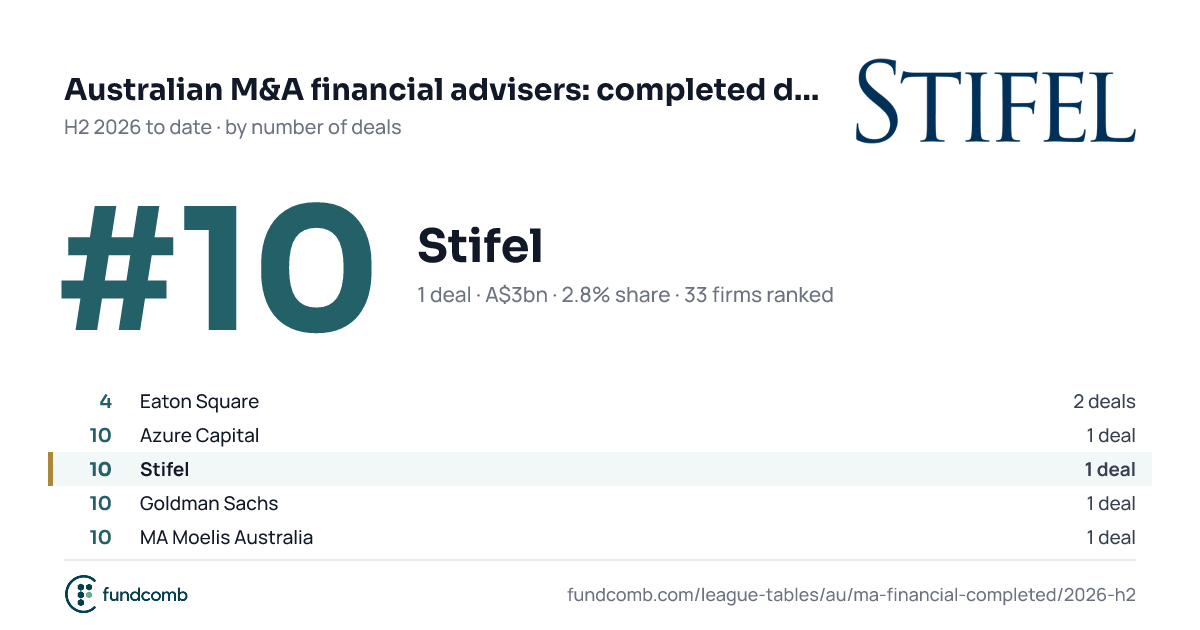
| 10 | Stifel A$3bn · 2.6% share · new | 3,000.0 | 2.6% | New | |
| |||||
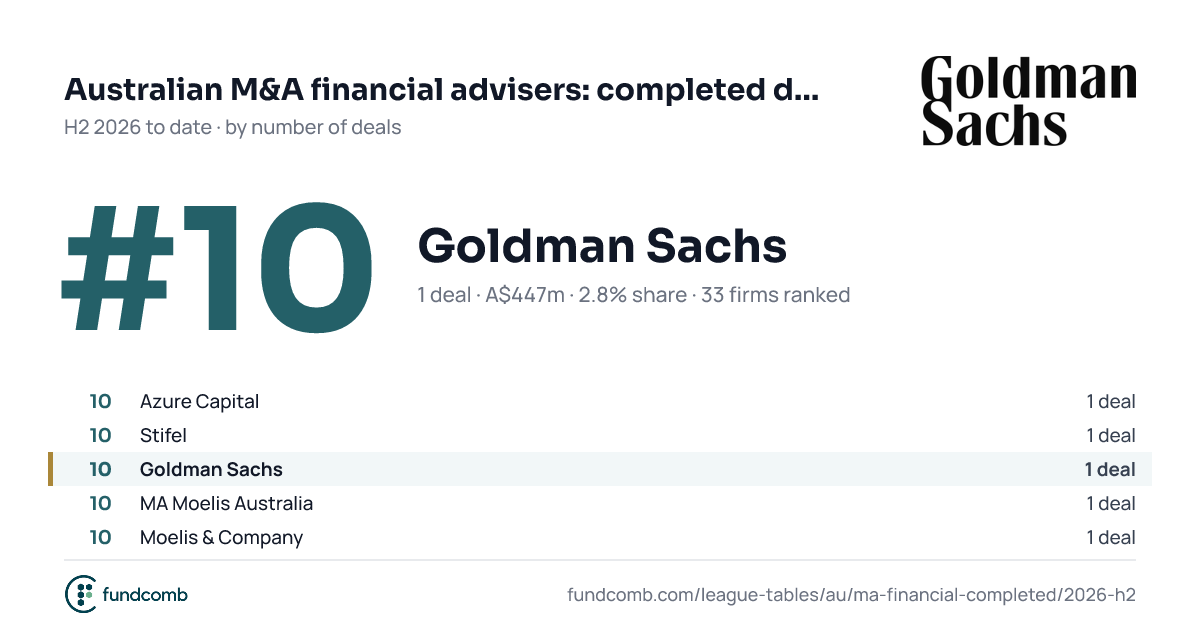
| 10 | Goldman Sachs A$447m · 2.6% share · was #2 | 447.0 | 2.6% | 2 , down 8 places | |
| |||||
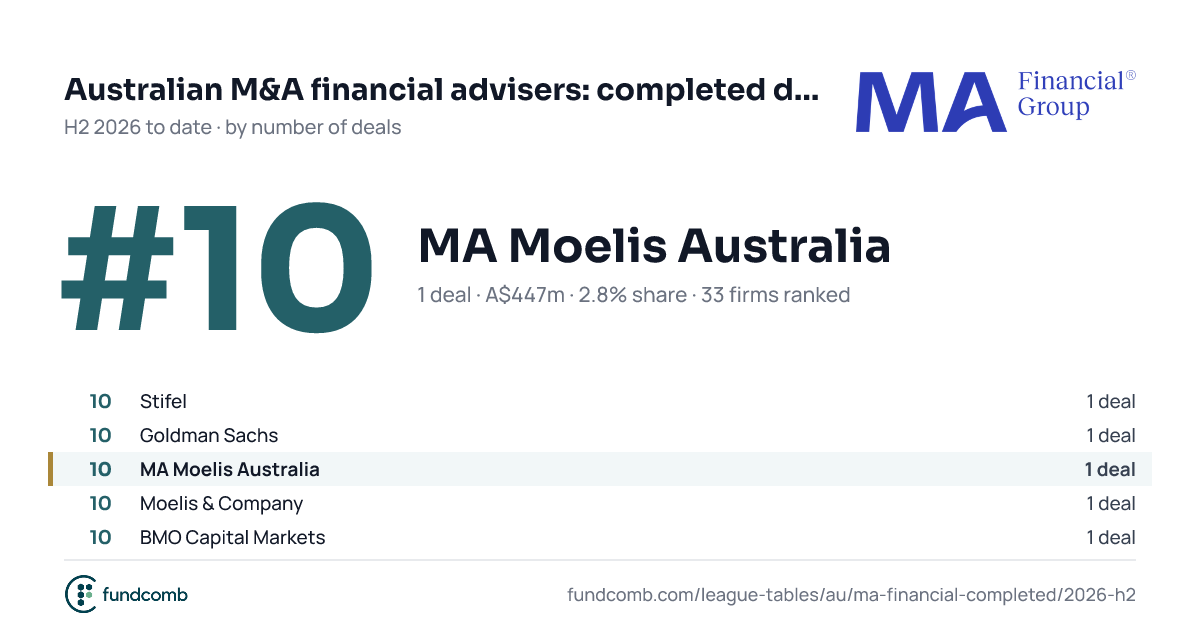
| 10 | MA Moelis Australia A$447m · 2.6% share · was #8 | 447.0 | 2.6% | 8 , down 2 places | |
| |||||
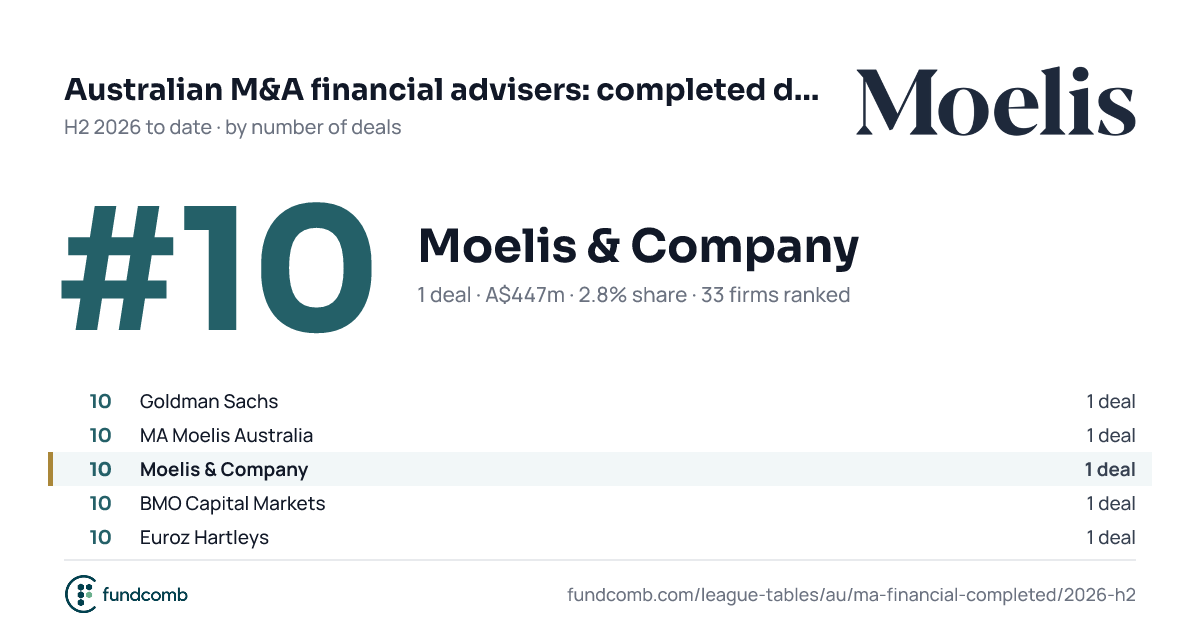
| 10 | Moelis & Company A$447m · 2.6% share · was #13 | 447.0 | 2.6% | 13 , up 3 places | |
| |||||
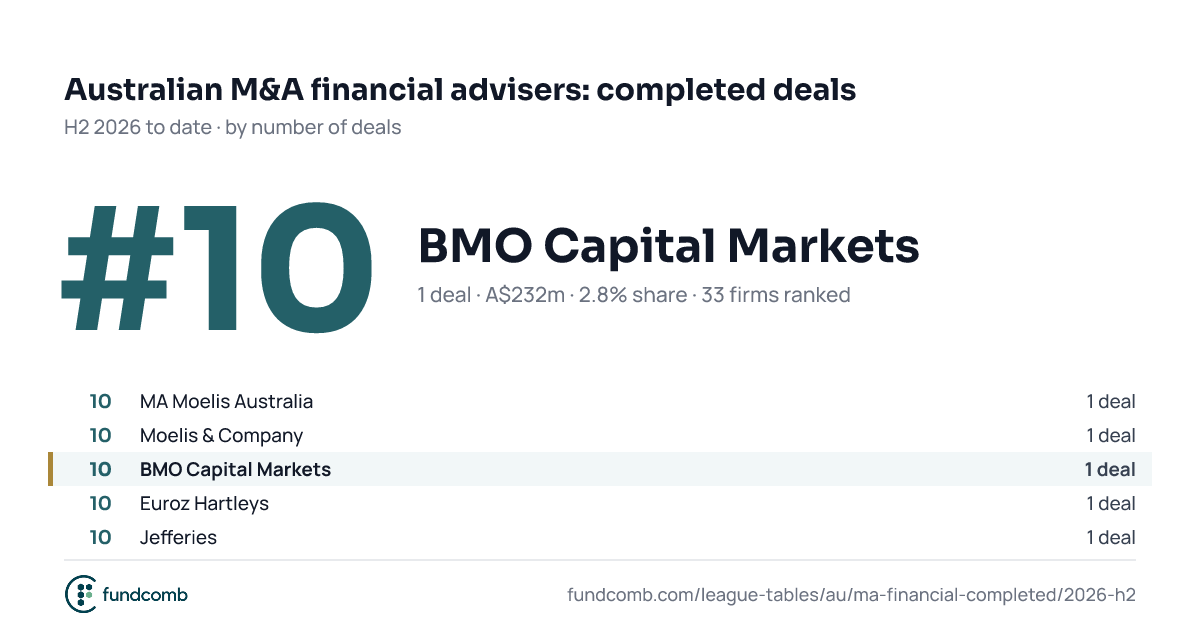
| 10 | BMO Capital Markets A$232m · 2.6% share · was #13 | 232.0 | 2.6% | 13 , up 3 places | |
| |||||
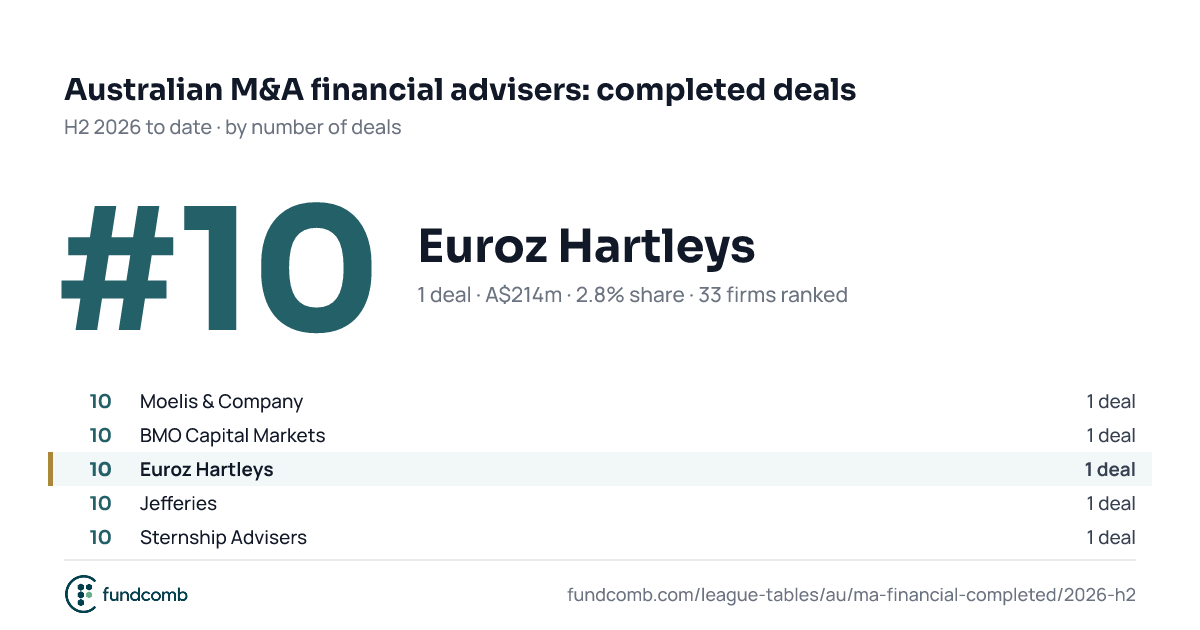
| 10 | Euroz Hartleys A$214m · 2.6% share · was #3 | 214.0 | 2.6% | 3 , down 7 places | |
| |||||
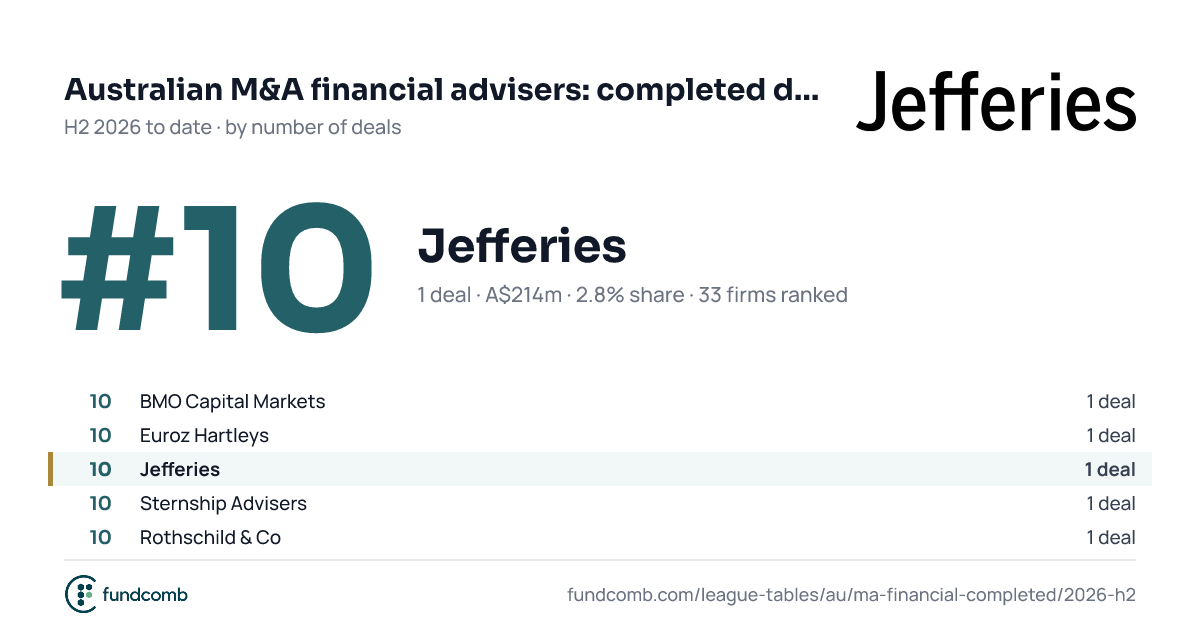
| 10 | Jefferies A$214m · 2.6% share · was #3 | 214.0 | 2.6% | 3 , down 7 places | |
| |||||
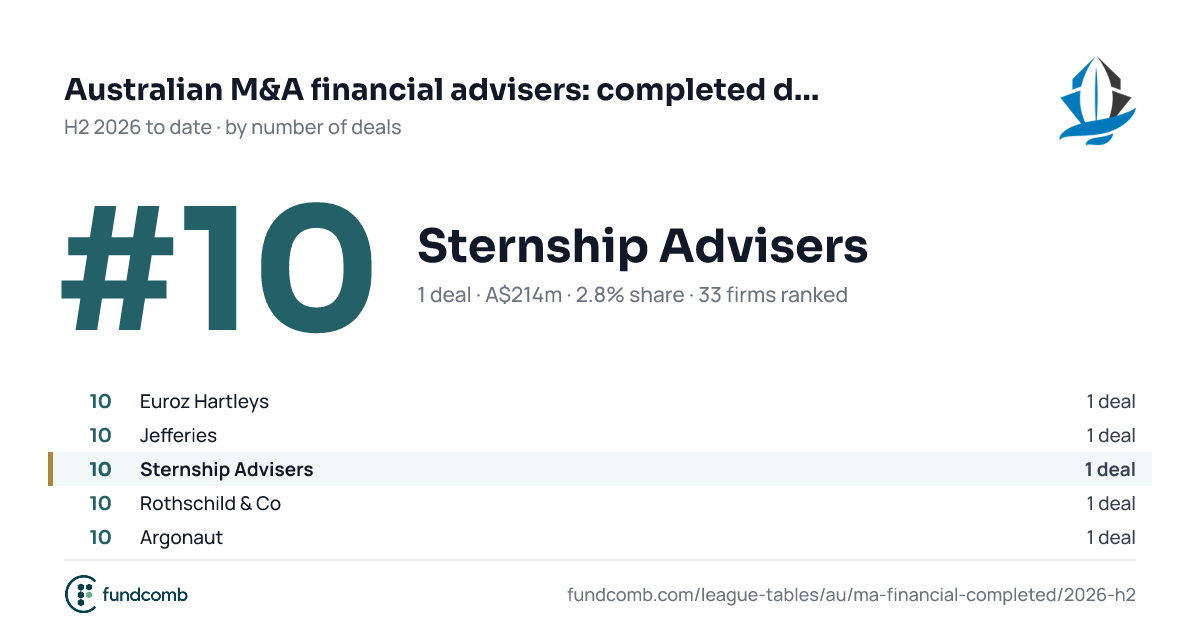
| 10 | Sternship Advisers A$214m · 2.6% share · was #8 | 214.0 | 2.6% | 8 , down 2 places | |
| |||||
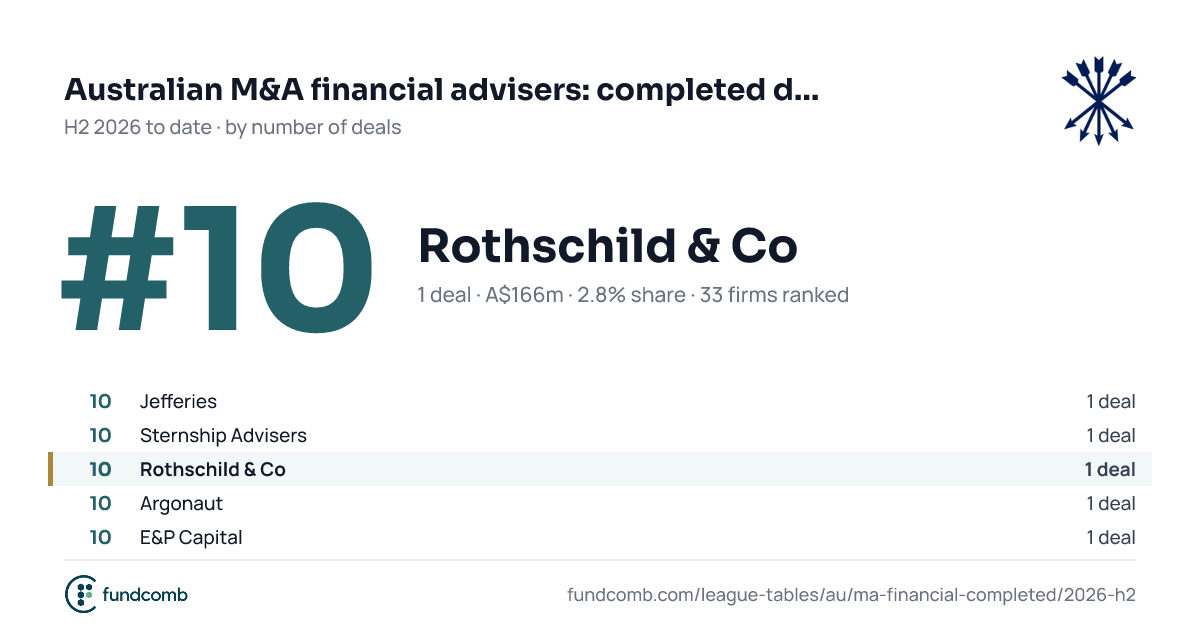
| 10 | Rothschild & Co A$166m · 2.6% share · new | 166.4 | 2.6% | New | |
| |||||
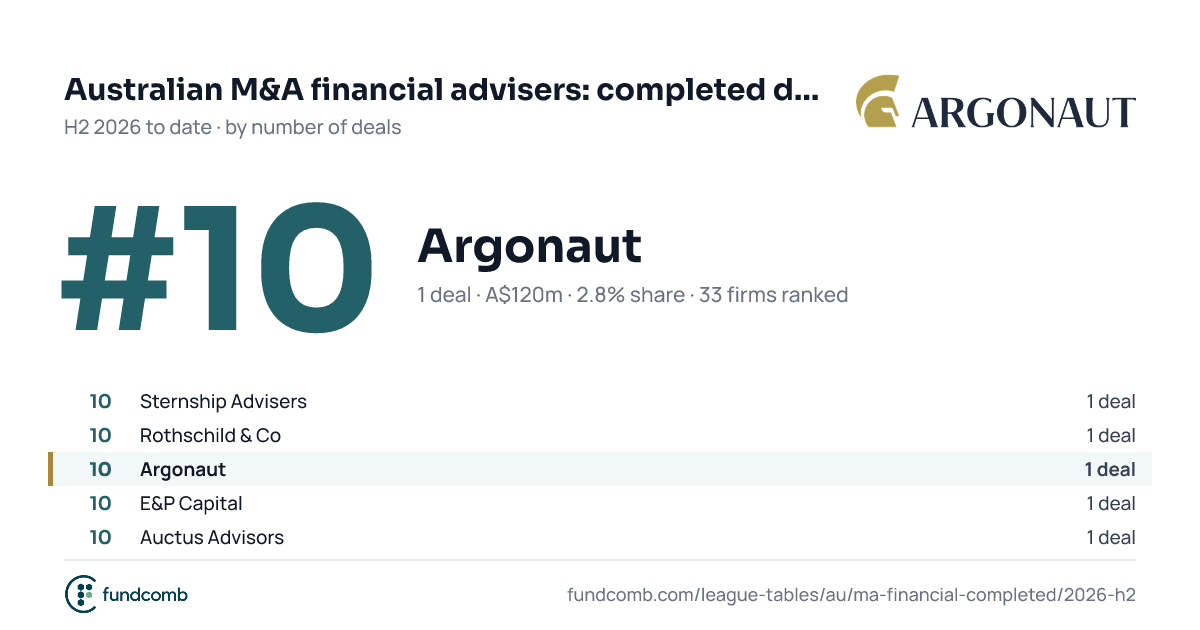
| 10 | Argonaut A$120m · 2.6% share · new | 120.0 | 2.6% | New | |
| |||||
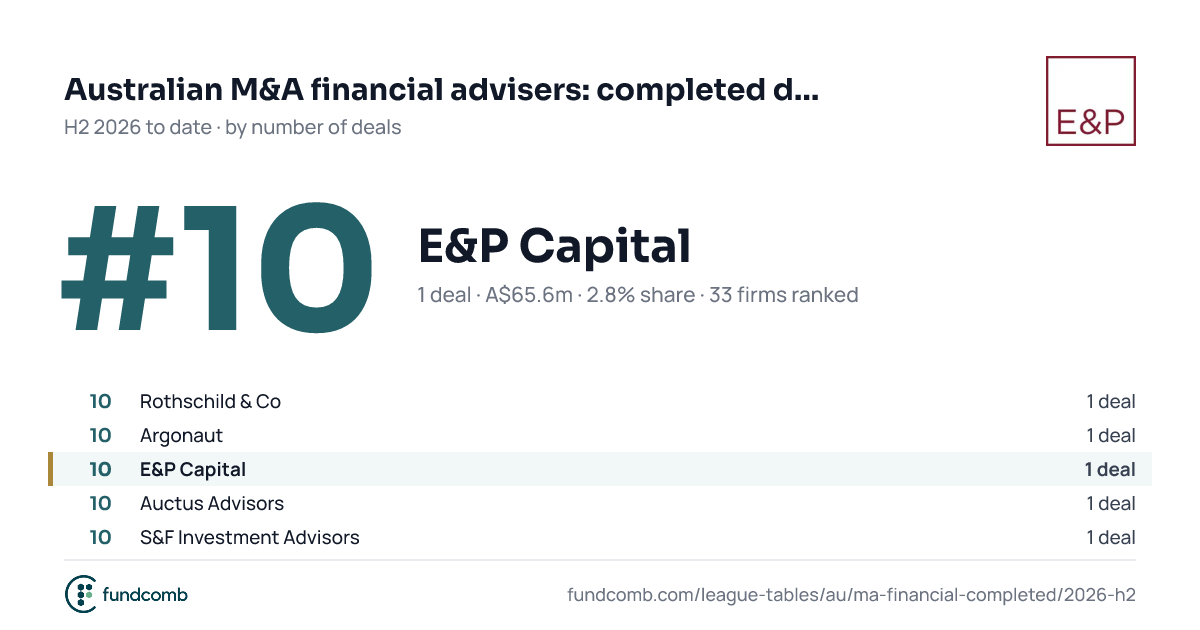
| 10 | E&P Capital A$65.6m · 2.6% share · new | 65.6 | 2.6% | New | |
| |||||
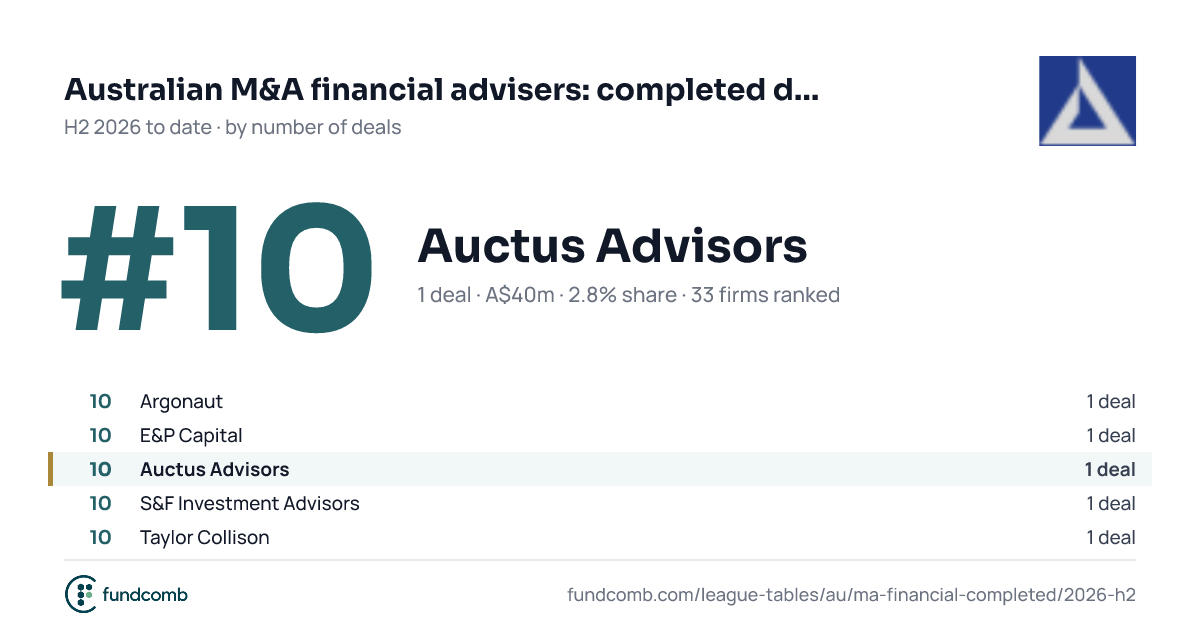
| 10 | Auctus Advisors A$40m · 2.6% share · new | 40.0 | 2.6% | New | |
| |||||
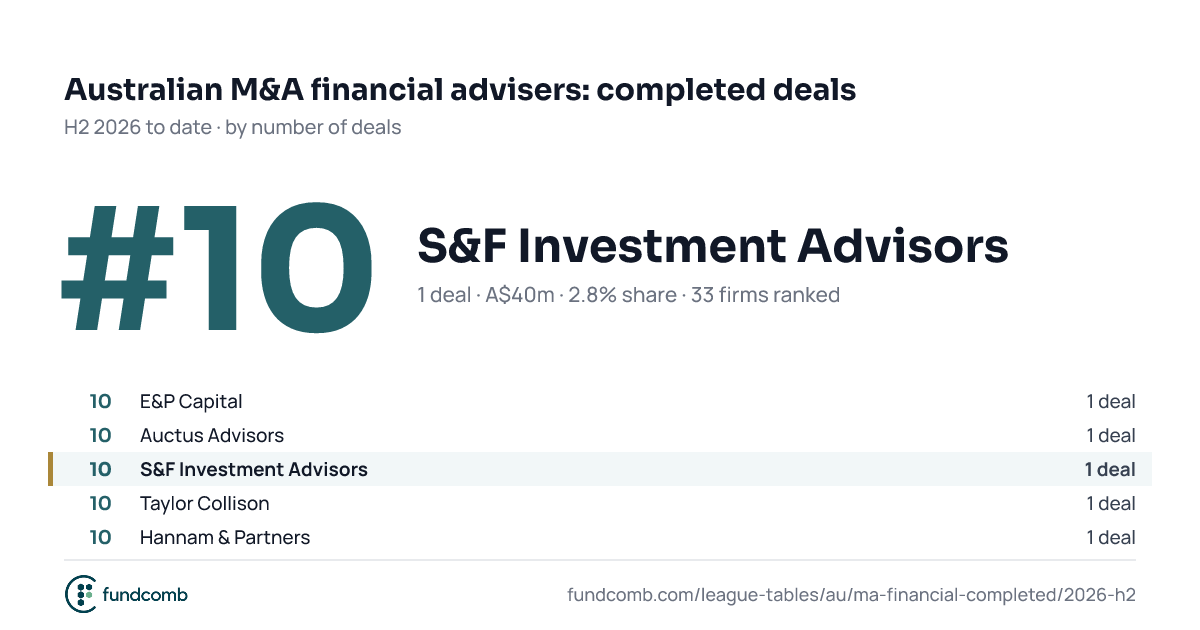
| 10 | S&F Investment Advisors A$40m · 2.6% share · new | 40.0 | 2.6% | New | |
| |||||
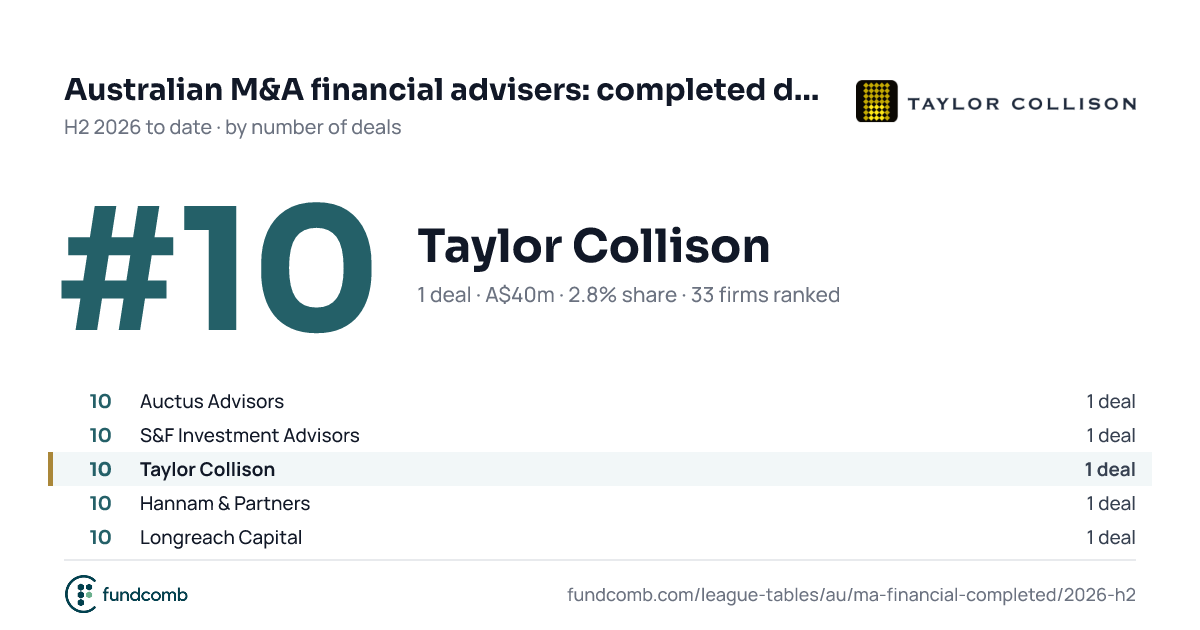
| 10 | Taylor Collison A$40m · 2.6% share · new | 40.0 | 2.6% | New | |
| |||||
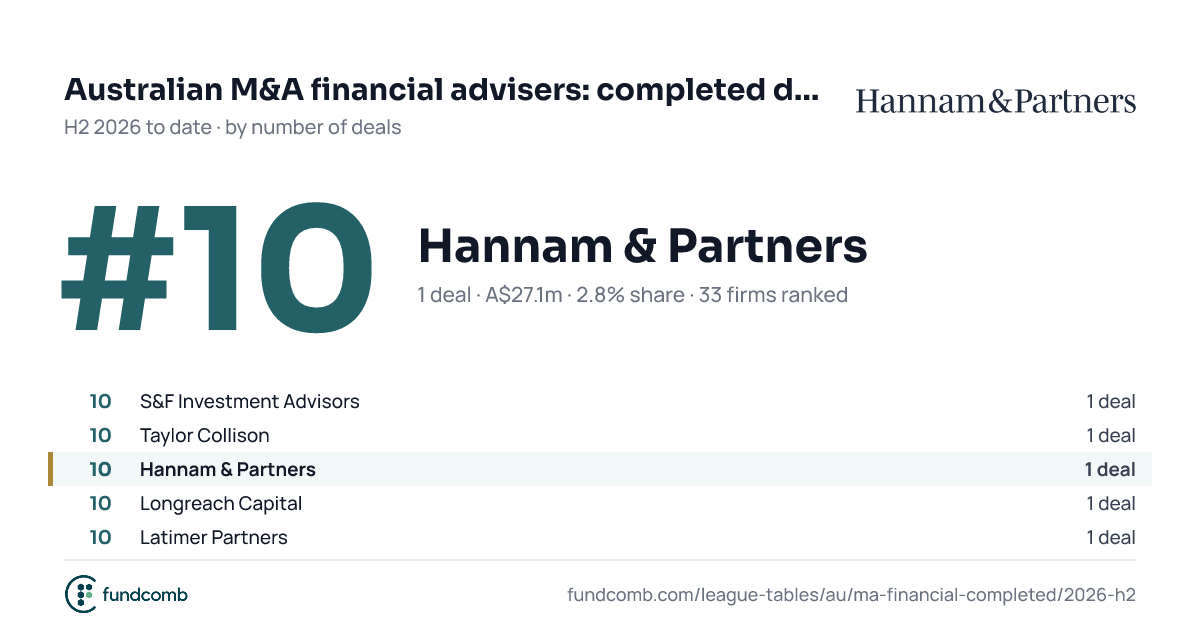
| 10 | Hannam & Partners A$27.1m · 2.6% share · new | 27.1 | 2.6% | New | |
| |||||
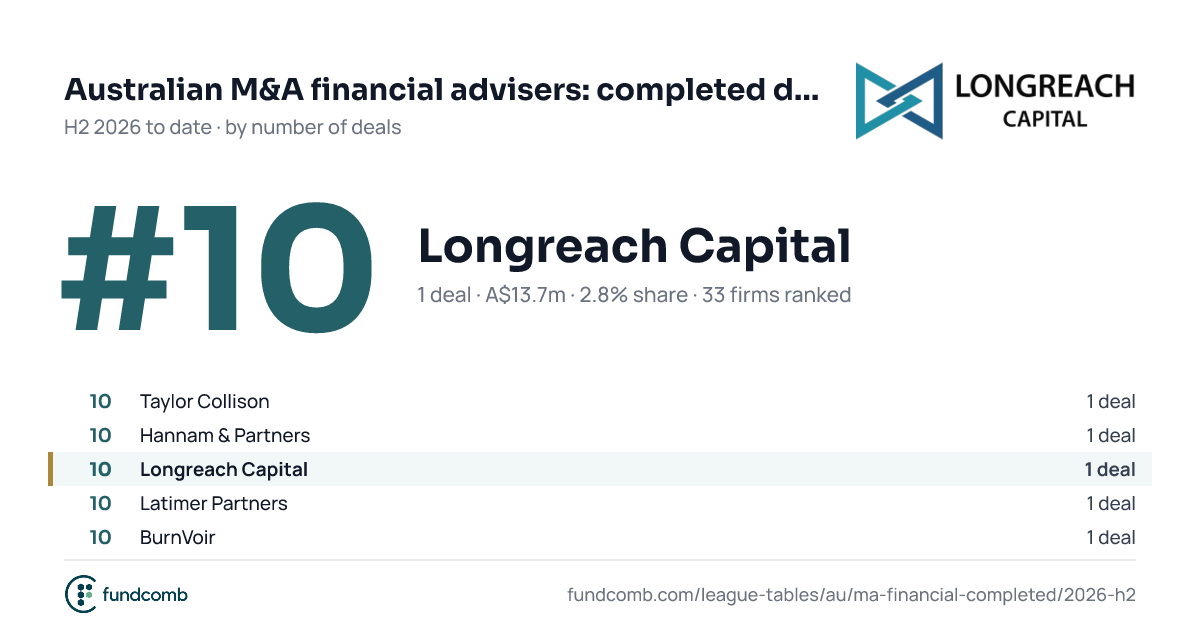
| 10 | Longreach Capital A$13.7m · 2.6% share · was #8 | 13.7 | 2.6% | 8 , down 2 places | |
| |||||
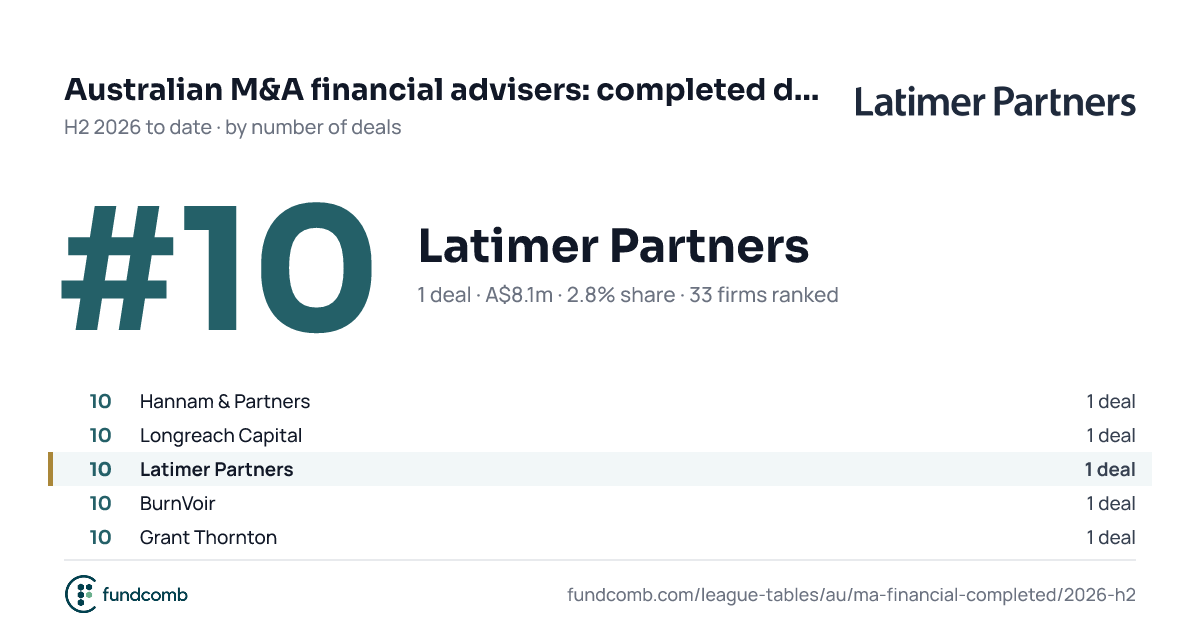
| 10 | Latimer Partners A$8.1m · 2.6% share · was #13 | 8.1 | 2.6% | 13 , up 3 places | |
| |||||
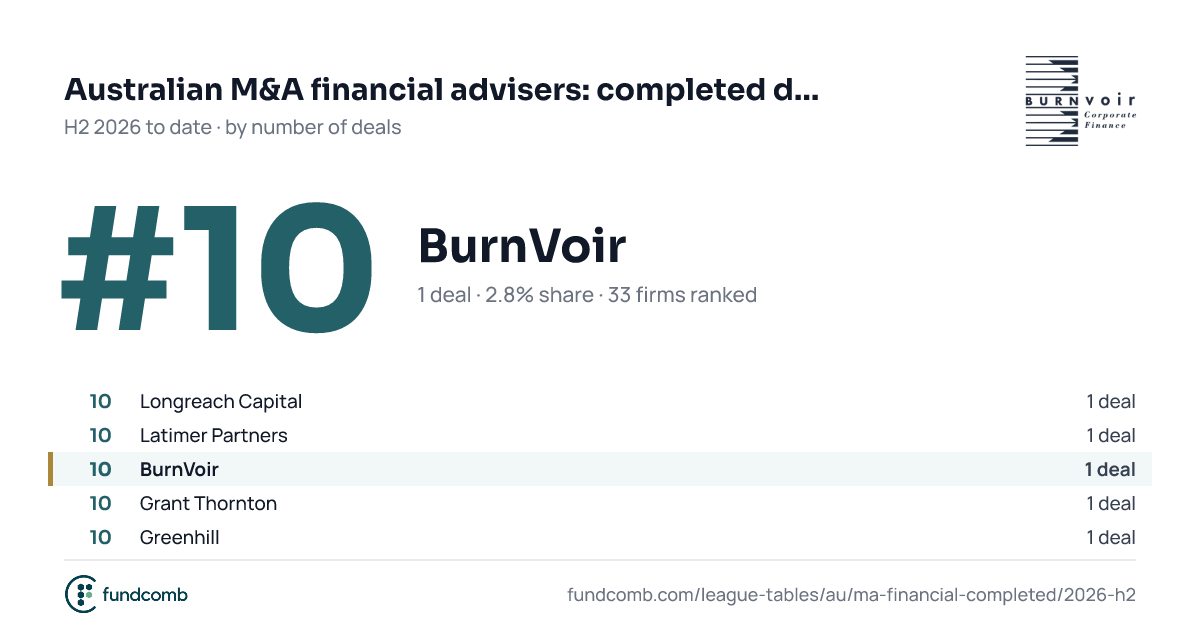
| 10 | BurnVoir 2.6% share · new | – | 2.6% | New | |
| |||||
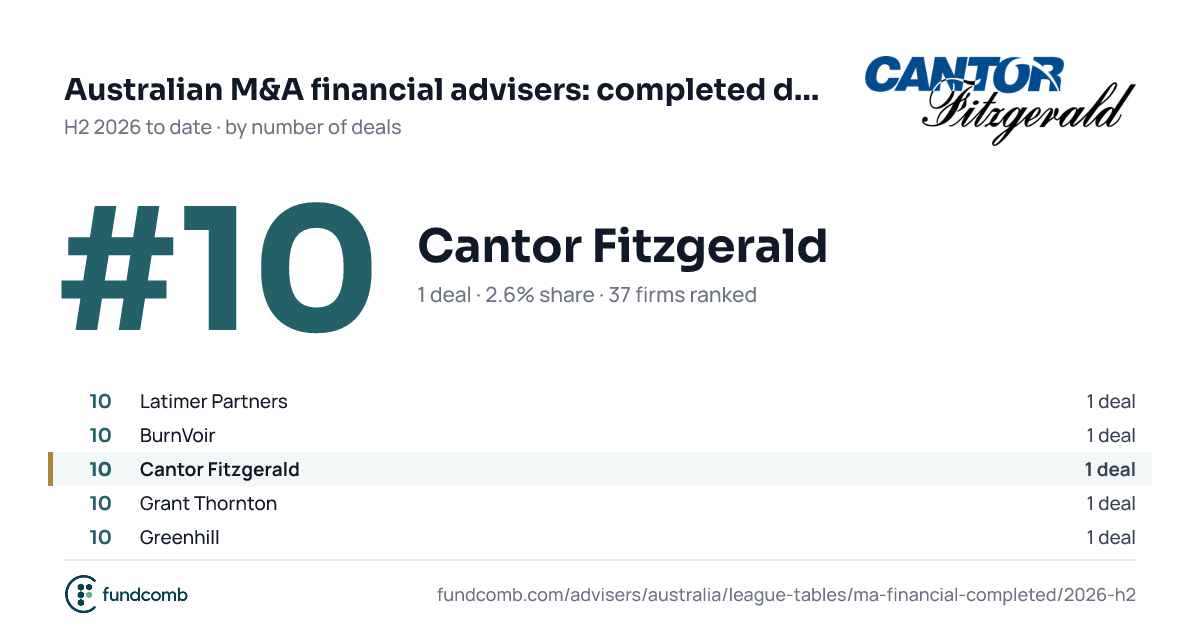
| 10 | Cantor Fitzgerald 2.6% share · new | – | 2.6% | New | |
| | |||||
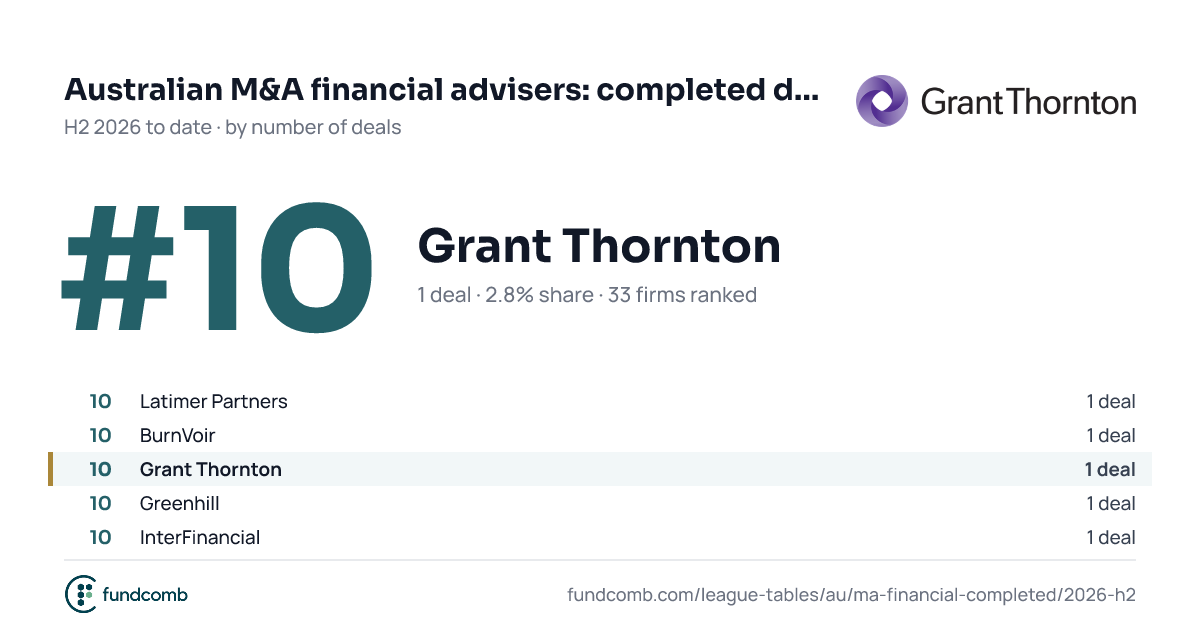
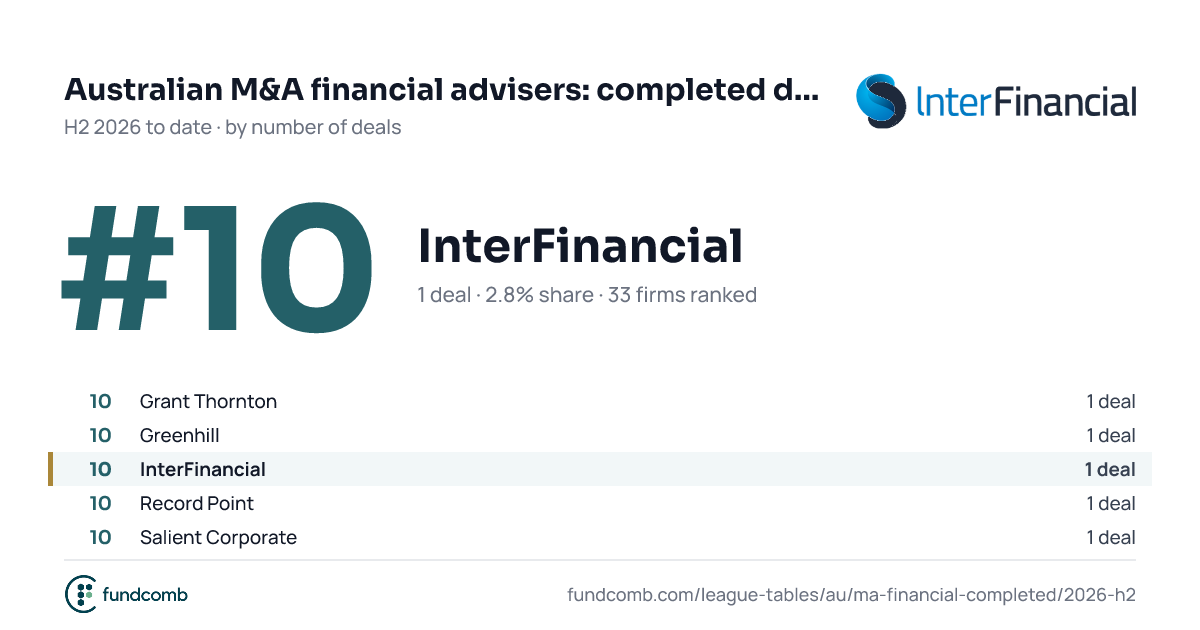
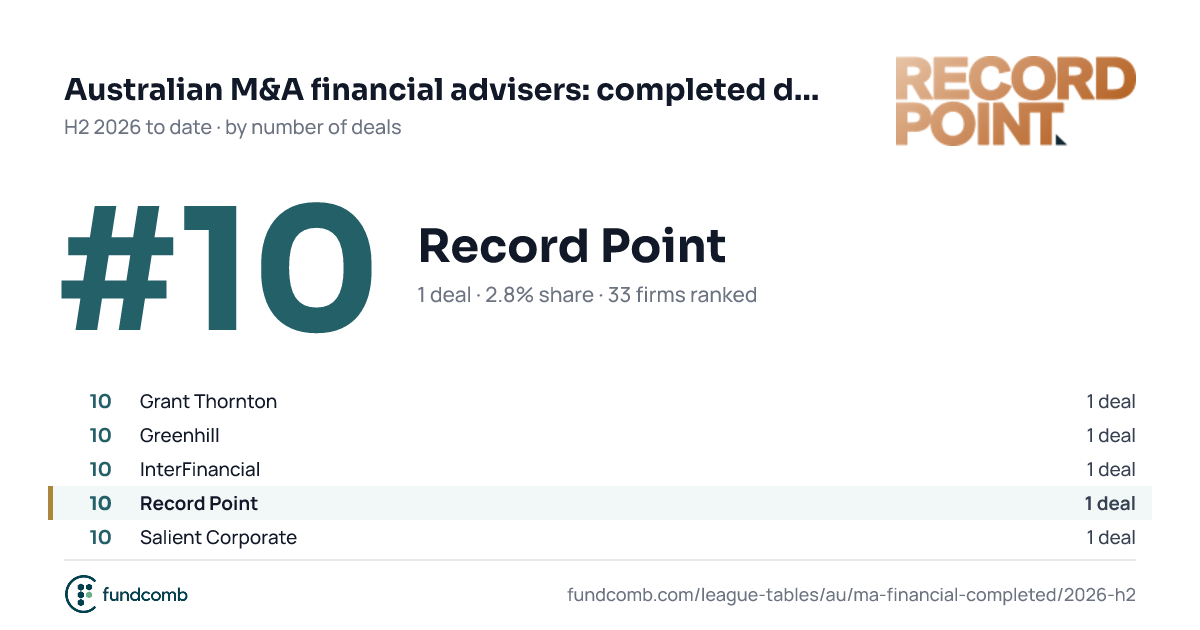
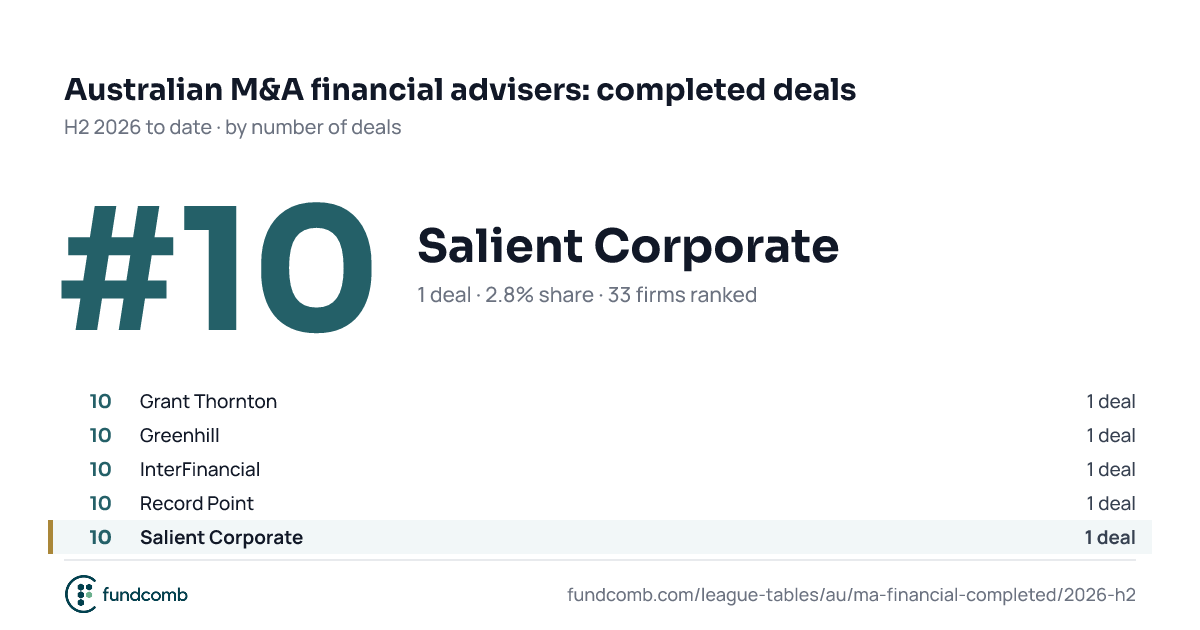
| 10 | Grant Thornton 2.6% share · new | – | 2.6% | New | |
| | |||||
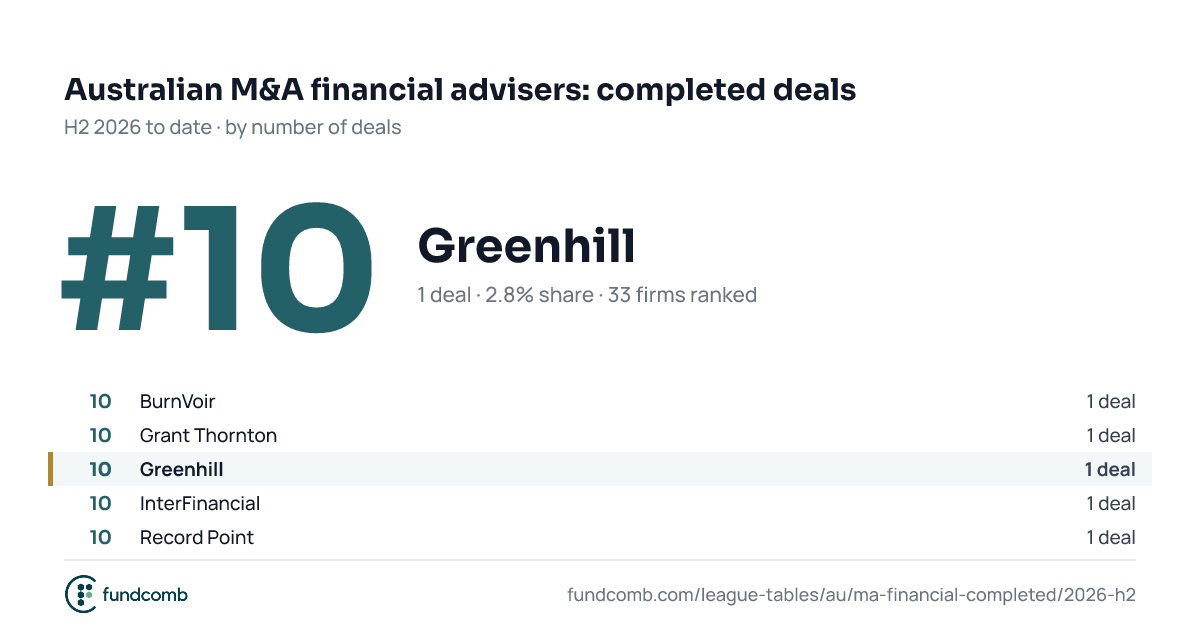
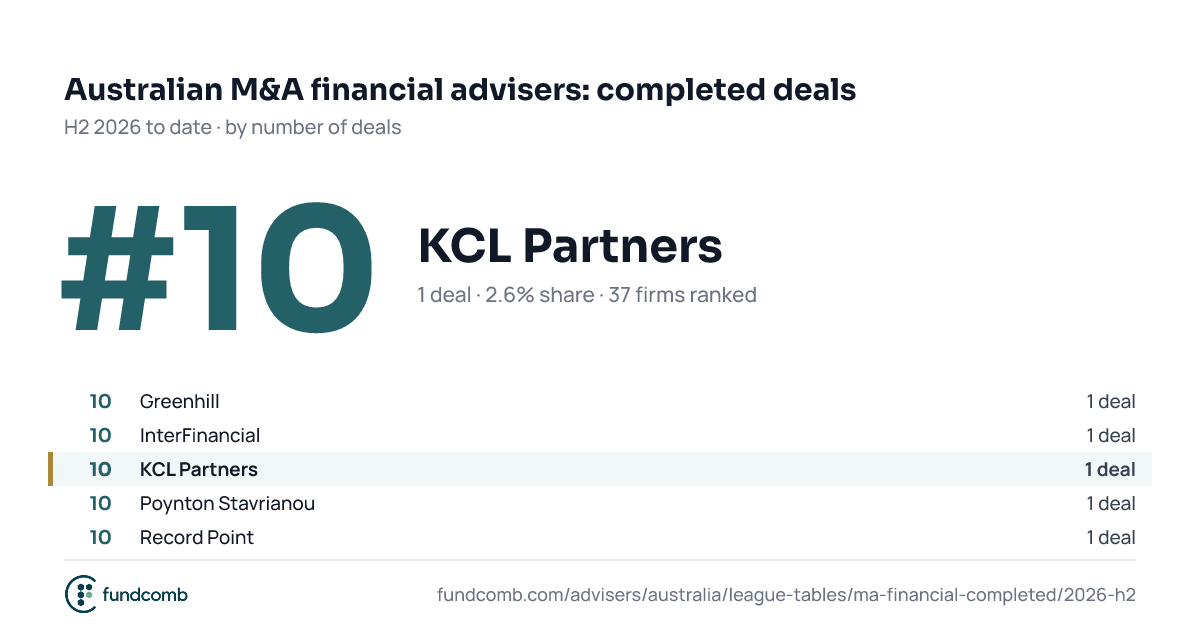
| 10 | Greenhill 2.6% share · was #13 | – | 2.6% | 13 , up 3 places | |
| | |||||
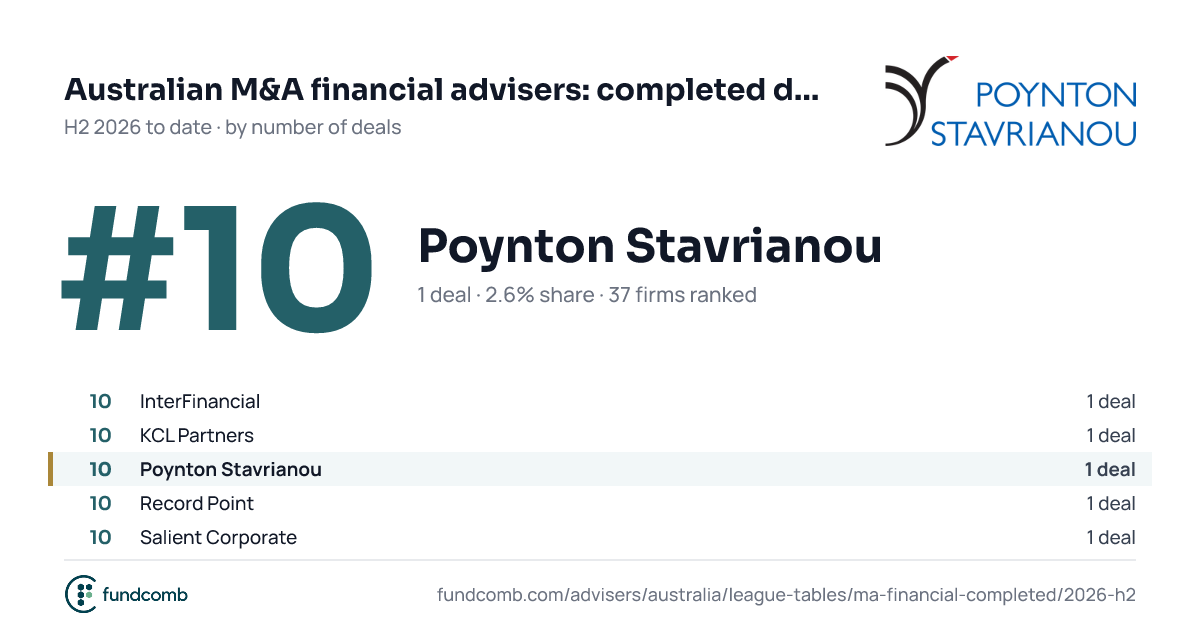
| 10 | InterFinancial 2.6% share · was #13 | – | 2.6% | 13 , up 3 places | |
| | |||||
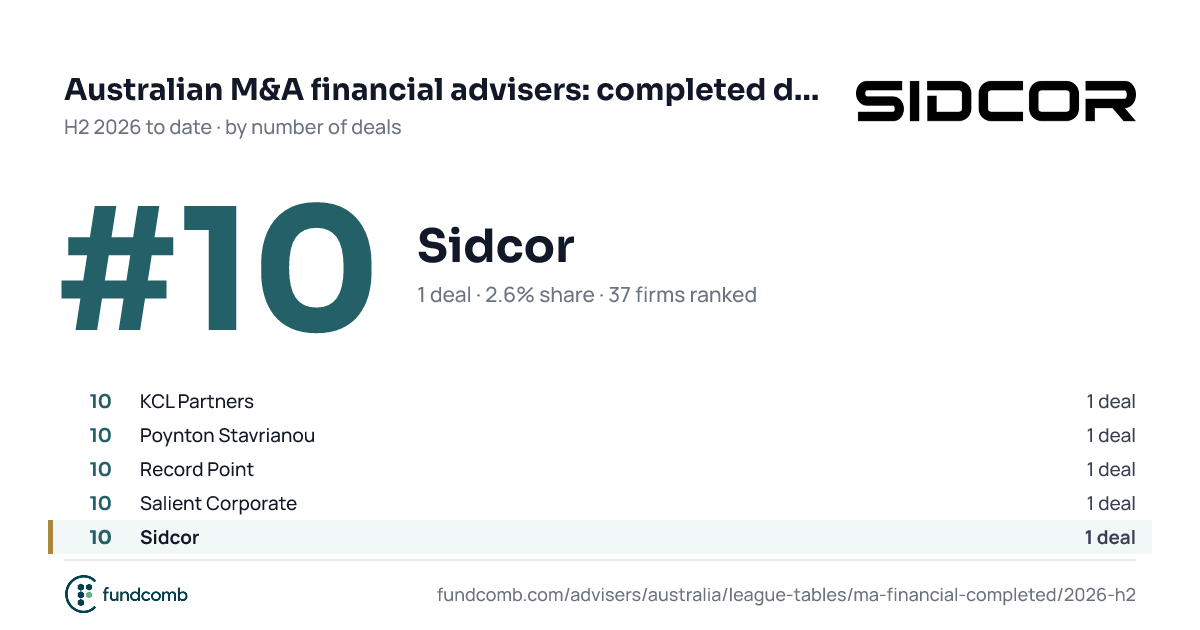
| 10 | KCL Partners 2.6% share · new | – | 2.6% | New | |
| |||||
| 10 | Poynton Stavrianou 2.6% share · new | – | 2.6% | New | |
| | |||||
| 10 | Record Point 2.6% share · was #13 | – | 2.6% | 13 , up 3 places | |
| | |||||
| 10 | Salient Corporate 2.6% share · new | – | 2.6% | New | |
| | |||||
| 10 | Sidcor 2.6% share · new | – | 2.6% | New | |
| |||||
Top ten by number of deals.
This table's top firms in each year.
17 deals have no disclosed value. H2 2025 rank is the firm's place in the same period a year earlier, under the same filters. Methodology